
Figure 4. Cardiac-Derived EVs enrich miRNA-27a* post myocardial infarction.
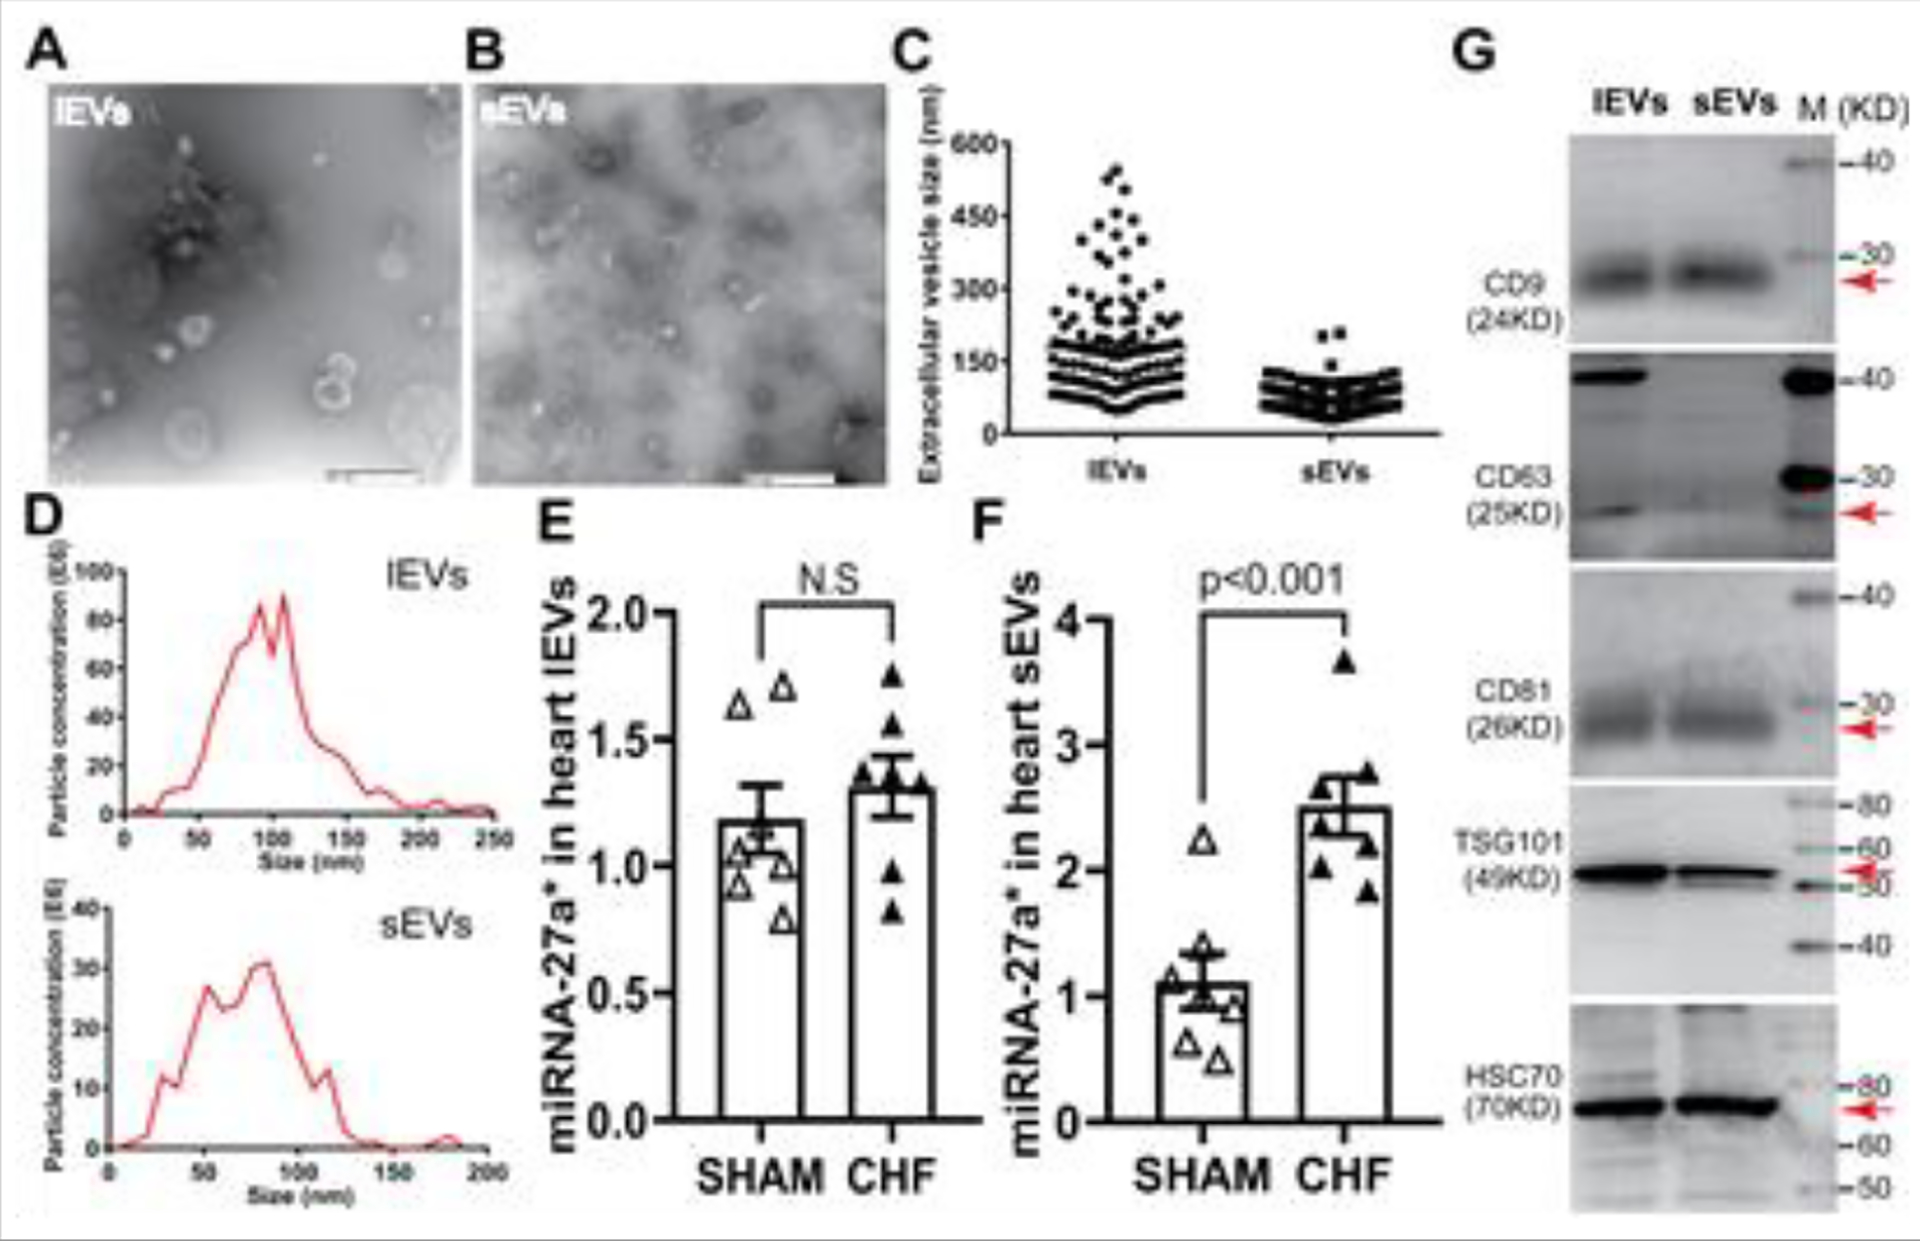
Transmission electron microscopy show the typical cup-shaped morphology of lEVs (A) and sEVs (B) scale bar is 500 nm; mean data are shown in C; EV characterizations by NanoSight analysis (D) and western blotting analysis; (G) qRT-PCR data show miRNA-27a* levels in both lEVs (E) and sEVs (F), cel-mir-39 was used as a spike-in control for EVs (±SEM, n=7).