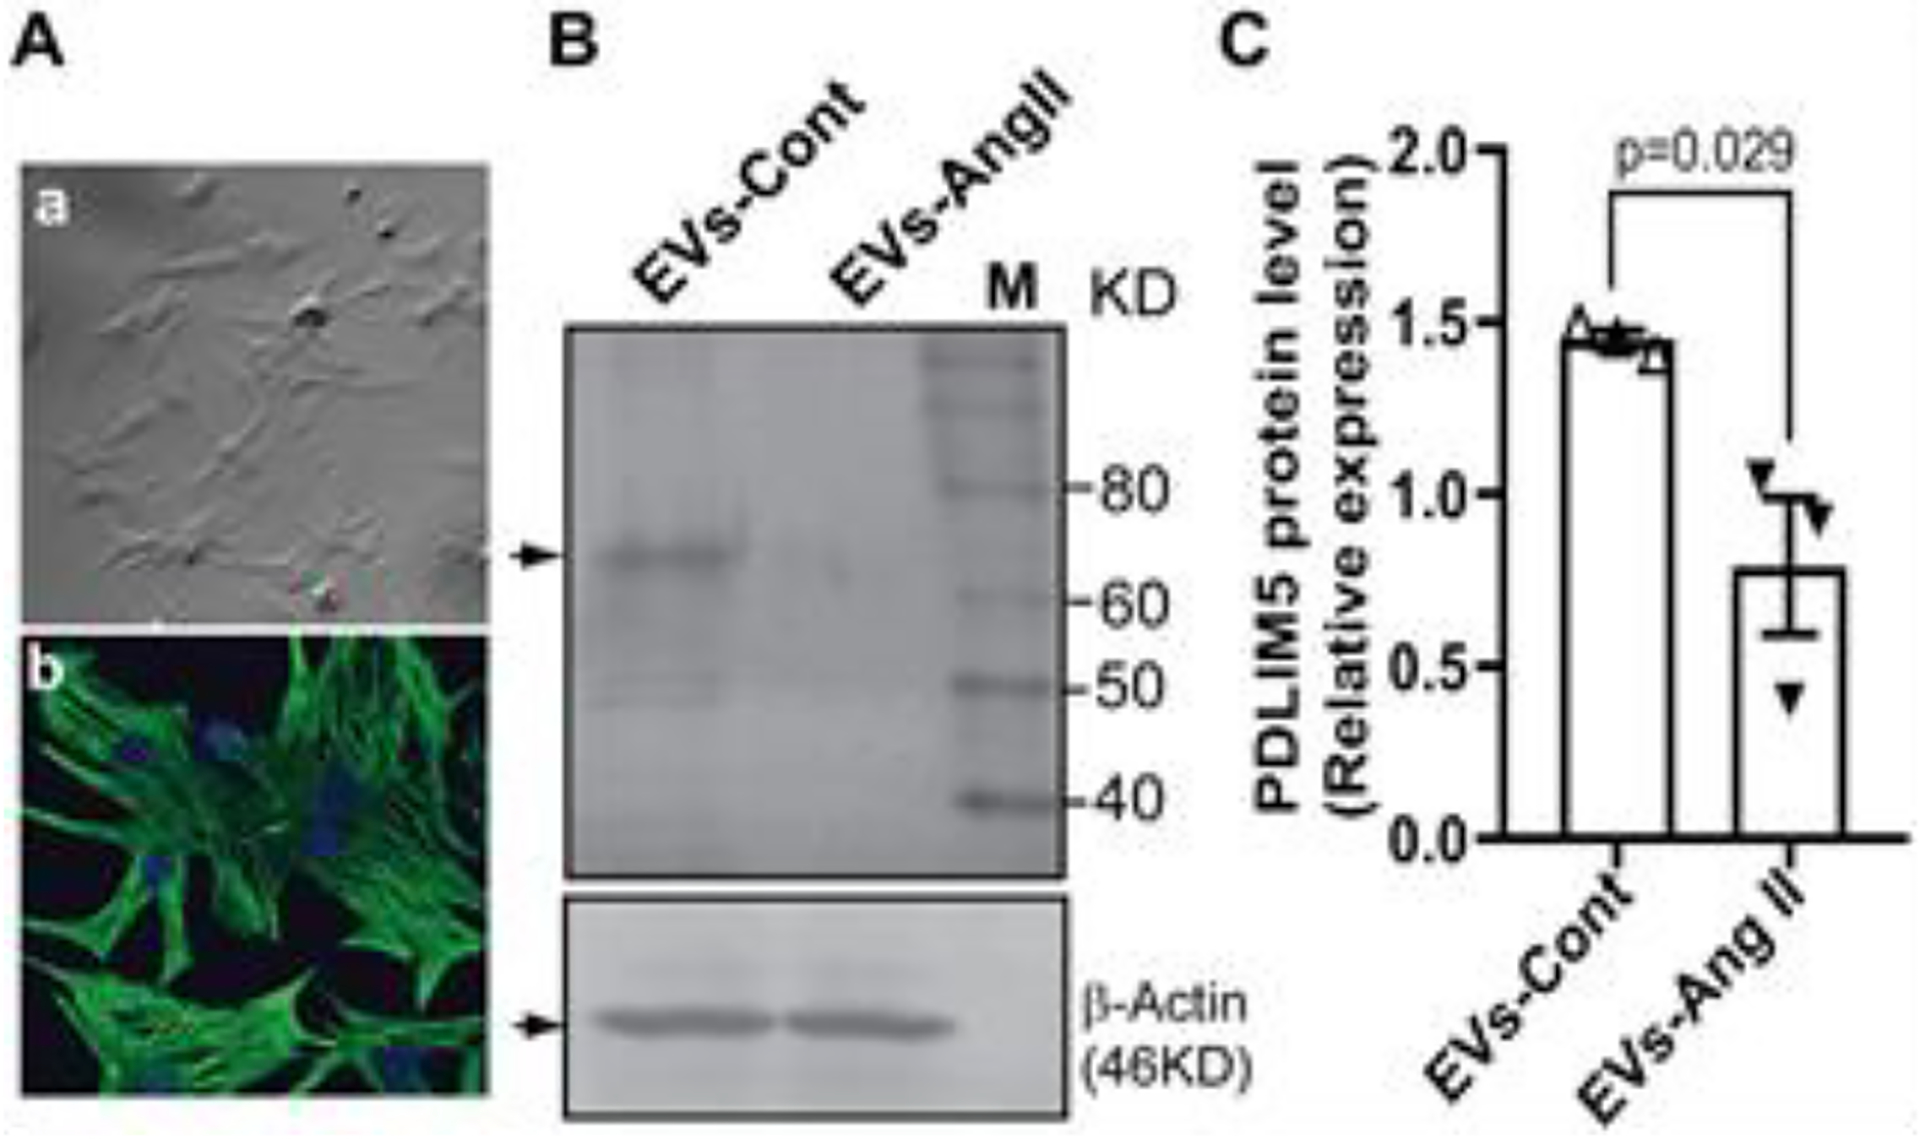
Figure 7. EV-enriched miRNA-27a* released from Ang II-treated RCF contribute s to PDLIM5 translational inhibition.

Primary cardiomyocytes show typical morphology (A-a) and cardiac troponin expression (cTnT, A-b). Nuclei are stained with DAPI. Scale bar is 20 μm; Western blot analysis show the down-regulation of PDLIM5 by EVs derived from Ang II-treated cardiac fibroblasts (EVs-Ang II) (B) and pool data were shown in (C), and β-actin was used as a loading control. Data represent the mean (± S.E.M) of three independent experiments,
