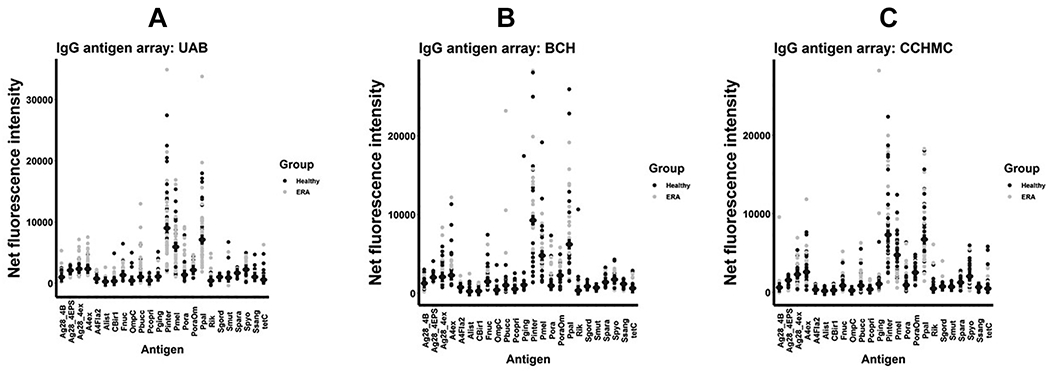
Figure 2.

IgG antigen arrays. Net fluorescent intensities (mean, SD) are shown for the IgG antigen arrays performed on serum obtained from subjects at the University of Alabama at Birmingham (A), Boston Children’s Hospital (B), and the Cincinnati Children’s Hospital Medical Center (C).
