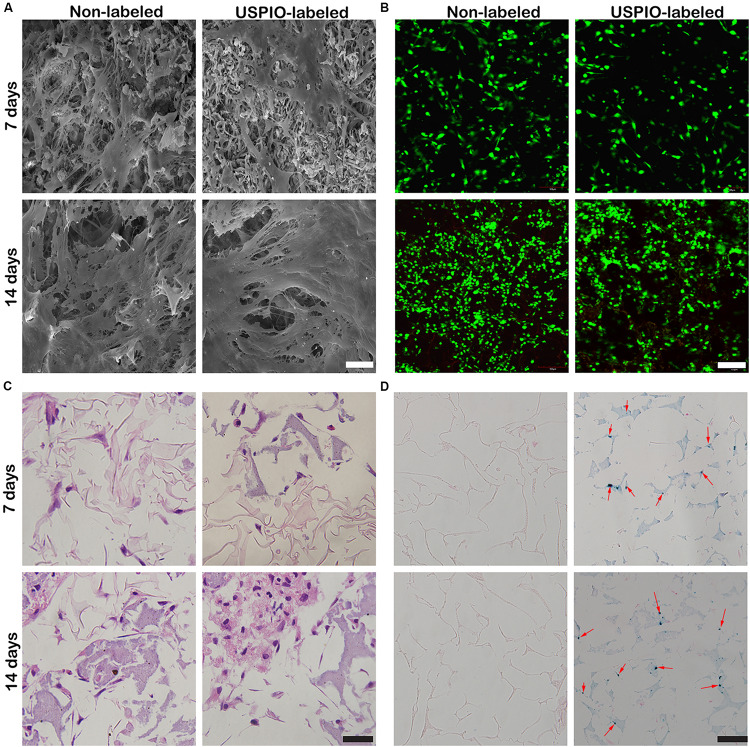
FIGURE 4.
Cell adhesion and growth cultured with USPIO-labeled and unlabeled scaffolds at 7 and 14 days. (A,B) SEM and Live/Dead staining show BMSCs adhered to scaffolds. Scale bar indicates 40 μm for SEM and 100 μm for Live/Dead staining. (C,D) H&E and Prussian staining of scaffold composites. Scale bar indicates 50 μm.

