
FIGURE 3.
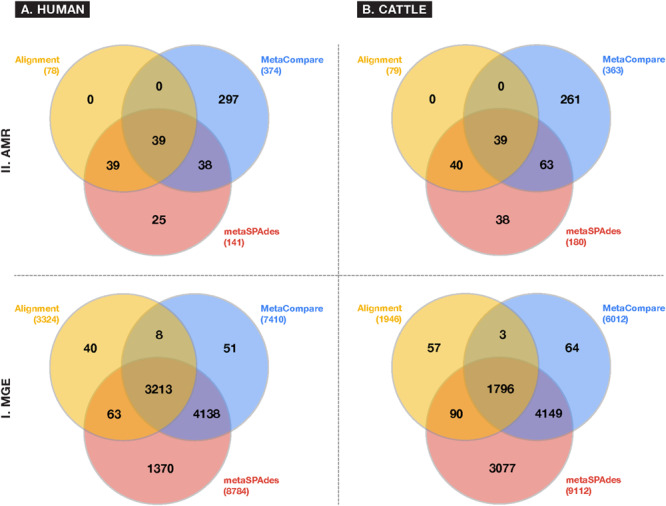
Venn diagrams depicting frequency of overlapping and differing unique gene groups identified in the (A) human and (B) cattle metagenomic datasets for either (I) MGE or (II) AMR accessions, using common approaches to colocalize resistomes and mobilomes: Sequence alignment (yellow); direct metagenomic assembly-metaSPAdes (red); and assembly based risk pipeline-MetaCompare. Numbers in parenthesis represent the total number of unique gene groups identified by a given approach.