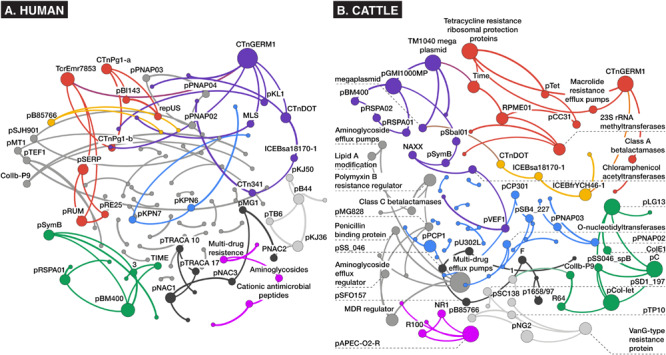
FIGURE 6.

Bayesian networks of (A) human and (B) cattle metagenomes, depicting nodes corresponding to counts of aligned AMR or MGE accessions at the mechanism level of ontology, and edges (arrows) representing co-occurrence with >70% bootstrap support. Node size and label is proportional to betweenness centrality, and node hue depicts optimal modularity groupings revealed using the Louvain modularity algorithm (Blondel et al., 2008).
