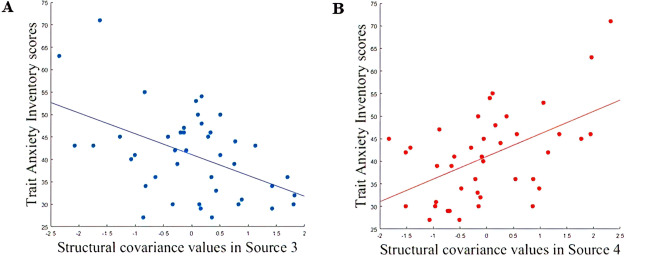
Figure 2.
A Correlation plot of Source 4 and STAI-Y2TRAIT scores (r = 0.5, p value = 0.0004; p valueFDR = 0.007). The caption is showing a positive correlation with the structural covariance network mainly localized in cerebellar areas. B Correlation plot of Source 3 and STAI-Y2TRAIT scores (r = − 0.5, p value = 0.001; p valueFDR = 0.009). The caption is showing a negative correlation with the structural covariance network mainly localized in precuneus, cuneus and middle temporal gyrus.

