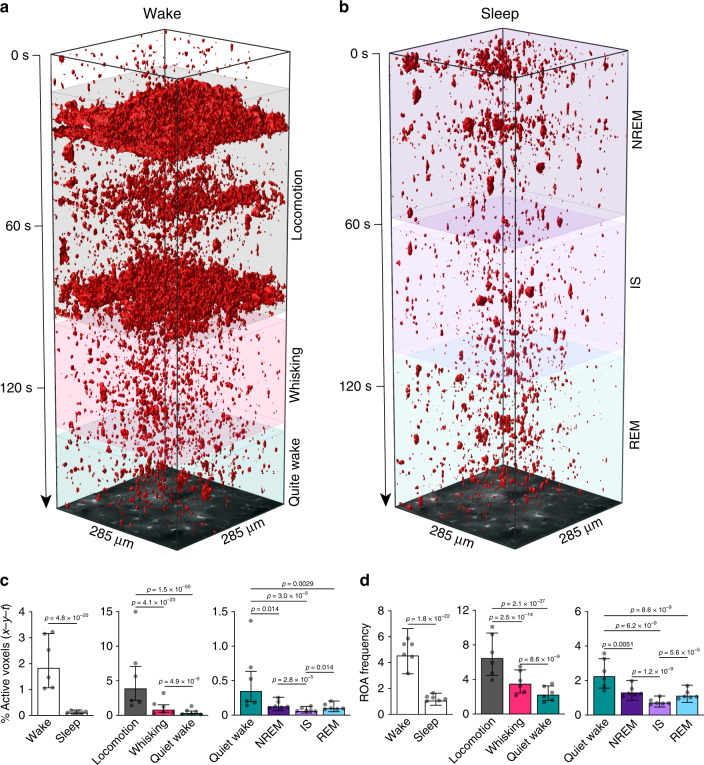
Fig. 2. Astrocytic Ca2+ signaling is reduced during sleep and is sleep state specific.
a and b Representative x-y-t rendering of ROAs during wakefulness (a) and sleep (b). c Percentage of active voxels (x-y-t) during overall wakefulness and overall sleep (left), during locomotion, whisking and quiet wakefulness (middle), and during NREM, IS, and REM sleep as compared to quiet wakefulness (right). d Same as c but for ROA frequency expressed as number of ROAs per 100 μm2 per minute. Data represented as estimates ± SE and p-values (two-sided test, no adjustment for multiple comparisons) derived from linear mixed effects models statistics, n = 6 mice, 283 trials. For details on statistical analyses, see “Methods.” See also Supplementary Figs. 8–10.

