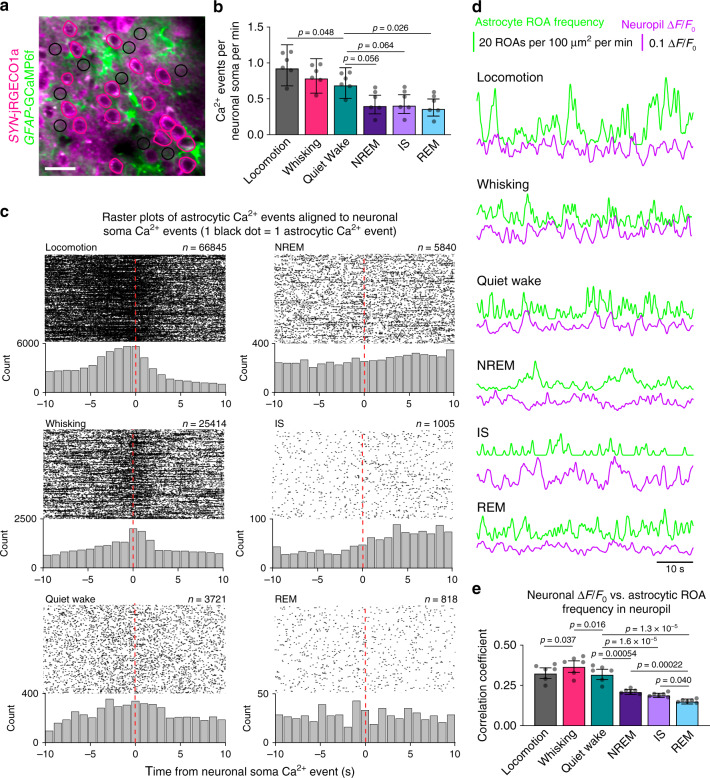
Fig. 6. Correlation of astrocytic and neuronal Ca2+ signals.
a Representative image of SYN-jRGECO1a fluorescence in neurons and GFAP-GCaMP6f fluorescence in astrocytes, and ROIs over neuron somata (pink) and neuropil (black circles of 10 μm in diameter). ROIs were manually segmented in 92 time series from 6 mice. Scale bar 20 μm. b Frequency of Ca2+ signals in neuron somata across sleep-wake states . Data represented as estimates ± SE, and p-values (two-sided test, no adjustment for multiple comparisons) derived from linear mixed effects models statistics, n = 6 mice, 92 trials. c Raster plots and histograms (1 s bins) of the onset time difference for astrocytic Ca2+ events in neuropil ROIs (black circular ROIs in a) relative to a Ca2+ event in neuron somata ROIs (pink ROIs over neuron somata in a). Each black dot represents the temporal location of one astrocytic Ca2+ event relative to a Ca2+ event in a neuronal soma. d Example traces of continuous astrocytic Ca2+ event frequency in neuropil ROIs (number of ROAs per 100 μm2 per minute), and neuronal Ca2+ signal ΔF/F0 in neuropil ROIs during locomotion, whisking, quiet wakefulness, NREM sleep, IS sleep, and REM sleep. e Correlation coefficient between continuous traces of astrocytic Ca2+ event frequency in neuropil, measured as number of ROAs per 100 μm2 per minute, and neuronal Ca2+ signal ΔF/F0 in neuropil across sleep-wake states. Data represented as estimates ± SE and p-values (two-sided test, no adjustment for multiple comparisons) derived from linear mixed effects models statistics, n = 6 mice, 81 trials. For details on statistical analyses, see “Methods”.

