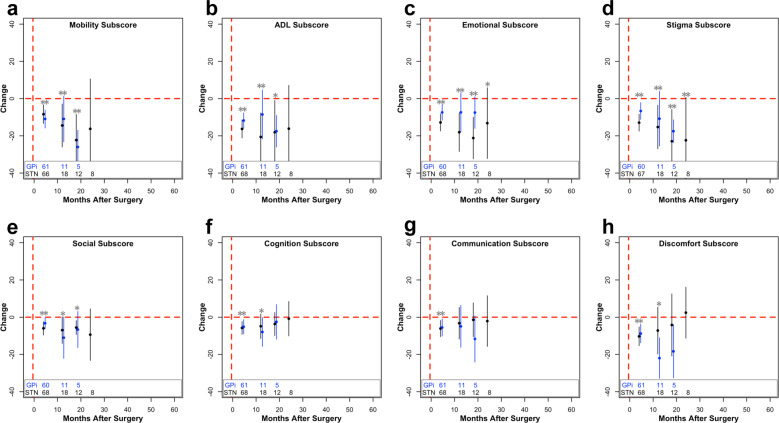
Fig. 3. Change in subscores of PDQ after staged bilateral first surgery.
Change from baseline (µ ± 2 × s.e.m.) within the mobility (a), ADL (b), emotional well-being (c), stigma (d), social support (e), cognition (f), communication (g), and bodily discomfort (h) subscores after staged bilateral first surgery. The number of patients included in each data point across time is listed at the bottom of each graph. For visualization purposes, bins with less than five data points are removed. Blue (GPi) or black (STN) stars (*p < 0.05; **p < 0.01) represent significant improvements in PDQ scores compared to baseline values, whereas gray stars with a line underneath represent significant differences between the STN and GPi at the specified time point. If a target was not significant within the mixed model, STN and GPi were pooled together, and compared to baseline, represented by a gray star without a line. These values were corrected for multiple comparisons using false discovery rate correction.

