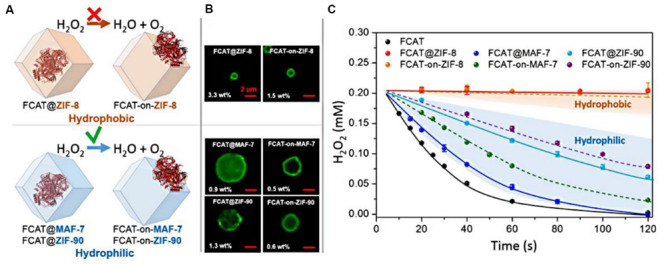
FIGURE 3.

(A) Schematic representations of the different FCAT/ZIF bio-composites formed by encapsulation of enzyme molecules via biomimetic mineralization or surface adsorption within/on hydrophobic (orange) or hydrophilic (blue) frameworks. (B) Confocal laser scanning micrographs showing fluorescence of different FCAT/ZIF bio-composites. (C) Catalytic activity of FCAT and different FCAT/ZIF composites. The assay was performed with FCAT concentration of 20 nM and H2O2 concentration of 0.20 mM. Reproduced from Liang et al. (2019) with permission from the American Chemical Society, copyright 2019.
