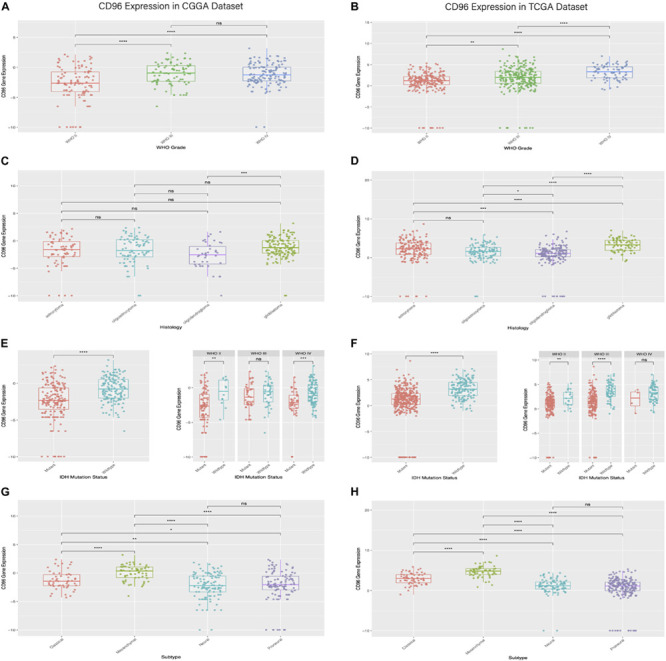
FIGURE 1.

Relationship between CD96 expression and clinical glioma parameters in the CGGA and TCGA cohorts. (A,B) Correlation of CD96 transcript levels and WHO grade. (C,D) CD96 expression pattern in different WHO grades. (E,F) Association between CD96 expression and IDH-wildtype for all-grade glioma. (G,H) Correlation of CD96 transcript levels and glioma subtypes. Ns, **, ***, and **** represent no significant, p < 0.05, p < 0.01, and p < 0.0001, respectively.
