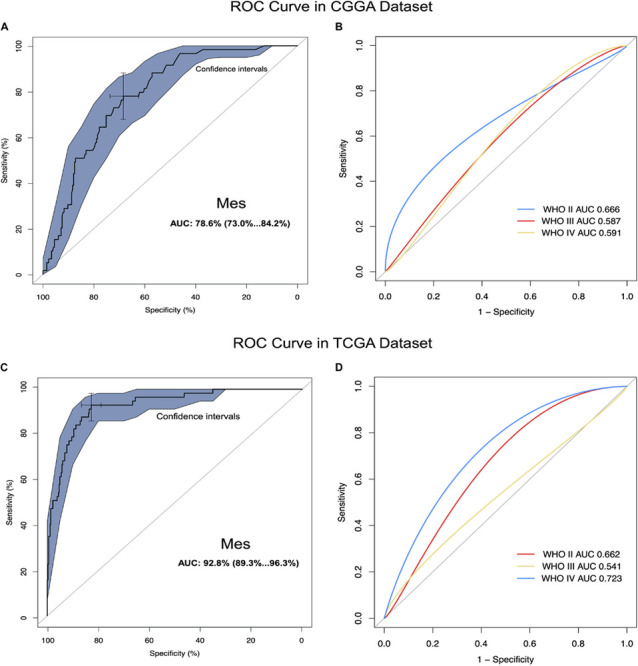
FIGURE 2.

CD96 was highly enriched in mesenchymal molecular subtype glioma. (A,B) ROC curve analysis of CD96 in mesenchymal subtype and all-grade gliomas in the CGGA dataset. (C,D) ROC curve analysis of CD96 in mesenchymal subtype and all-grade gliomas in the TCGA dataset.
