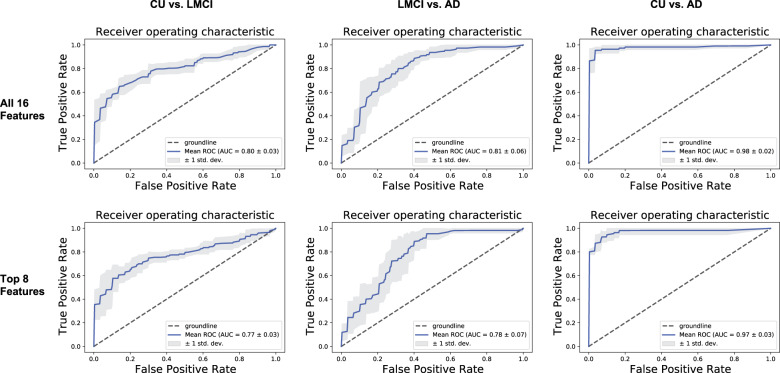
Fig. 1. Receiver operating characteristic (ROC) curves depicting the accuracy of all 16 biomarker features (top) vs. the top 8 biomarker features (bottom).
Comparison of receiver operating characteristic14 curves between all 16 biomarker features (top) and the top 8 biomarker features (bottom) from the three diagnosis participant group comparisons: cognitively unimpaired (CU) vs. late mild cognitive impairment (LMCI), LCMI vs. Alzheimer’s disease (AD), and CU vs. AD. Groundline refers to a model that cannot predict better than random chance. The mean ROC is calculated from the average of the five ROC curves produced from the k-fold cross validation.

