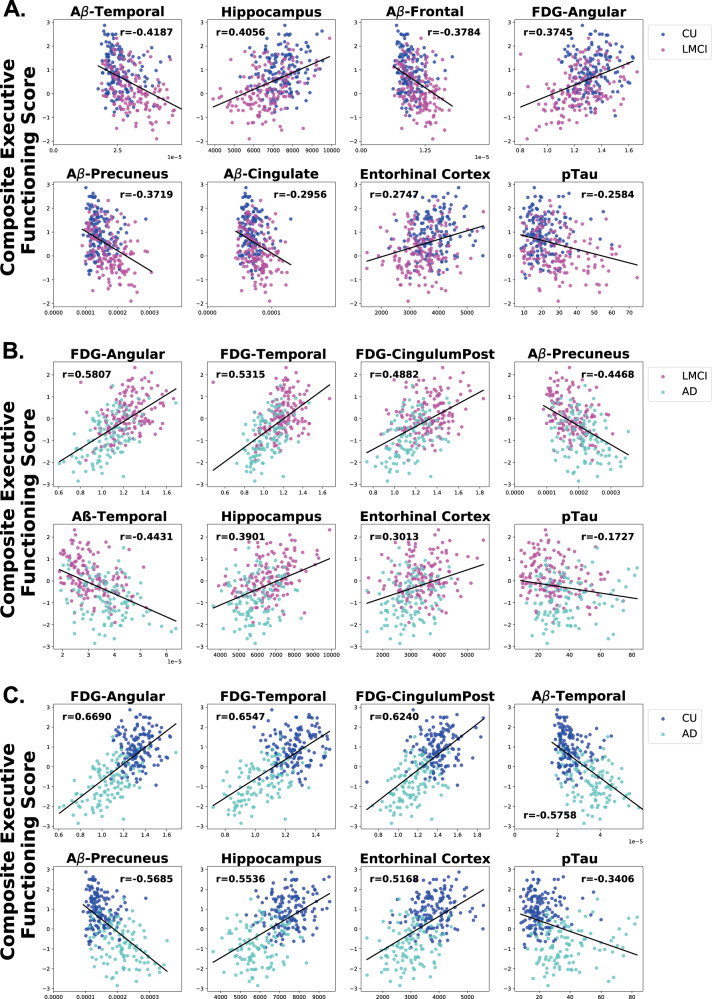
Fig. 3. Correlation of top eight AD biomarkers with executive functioning scores.
Scatter plots showing the correlations of the top eight features with performance on composite executive functioning tests in each pairwise analysis among the cognitive statuses (a) CU vs. LMCI. (b) LMCI vs. AD. (c) CU vs. AD. The order of the scatter plots in each panel is according to the rank of the r correlation value when compared to composite executive functioning score. The x-axis refers to the indicated biomarker score and the y-axis refers to the composite memory score. Each dot refers to the indicated biomarker score and composite executive functioning score of a single participant.

