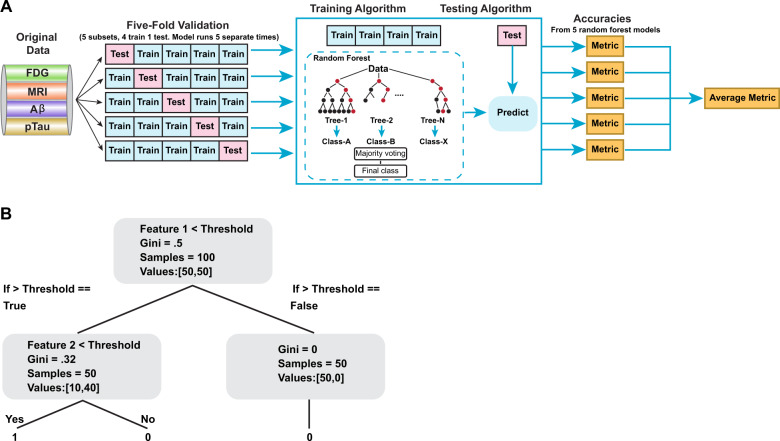
Fig. 5. Flow chart of the random forest method used.
a Flow chart depicting the analysis used with the random forest method. The AD biomarkers from the original dataset were randomly split into five equal-sized subsets. For evaluation, each complete data copy was forwarded into a random forest (decision tree; see b) classifier model. Final predictions were calculated and features were ranked based on the prediction of the majority of trees within that training dataset. b Decision trees are classified in a binary fashion, where the split in the trees are from either true or false responses to feature thresholds based on Gini Impurity. “Purity” is a measure homogeneity, with “0” as maximal purity, and “1” as maximal impurity.

