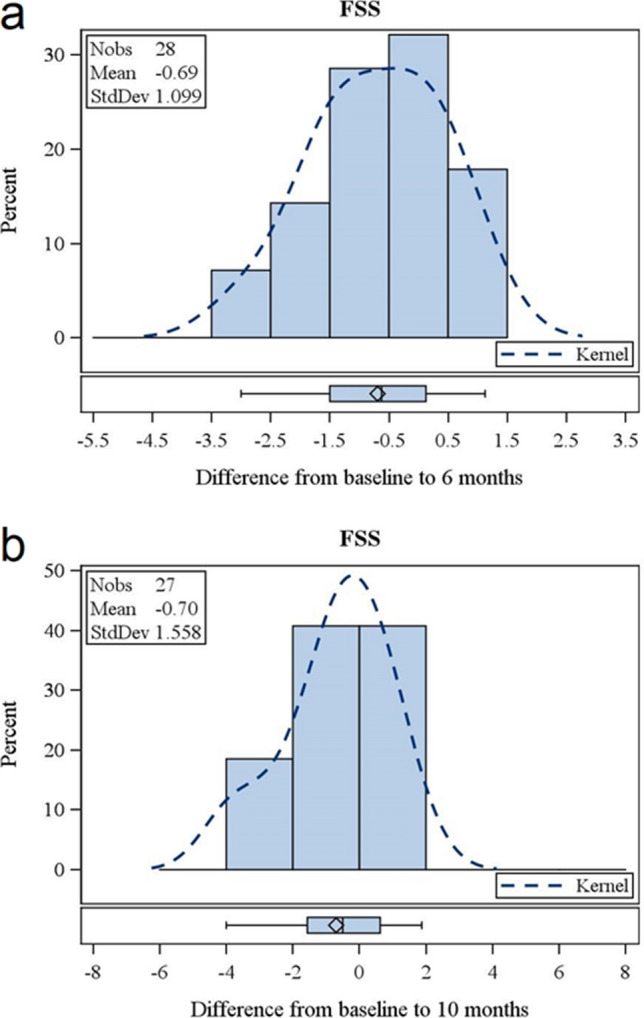
Figure 1.

Change of fatigue measured by FSS. Change of FSS after 6 months of treatment with nusinersen (a). Change of FSS after 10 months of treatment with nusinersen (b). Each bar represents the percentage of patients that had improved to this extent. Dotted lines represent the kernel of distribution. “I” represents median, “diamond” represents mean value, bottom and top edges of the box: Interquartile range (IQR); bottom and top edges of the whiskers: 1.5*IQR.
