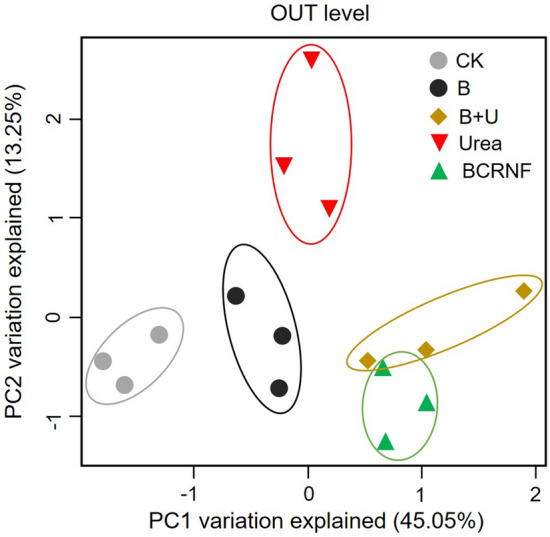
Figure 2.

Principal component analysis (PCA) to compare bacterial composition. The percentages on the axes are the percent of variance explained by the first (PCA1) and second (PCA2) principal components under different treatments. CK: untreated soil; B: soil treated with biochar; B + U: soil treated with biochar and urea; Urea: soil treated with only urea as nitrogen fertilizer; BCRNF: soil treated with BCRNF as nitrogen fertilizer.
