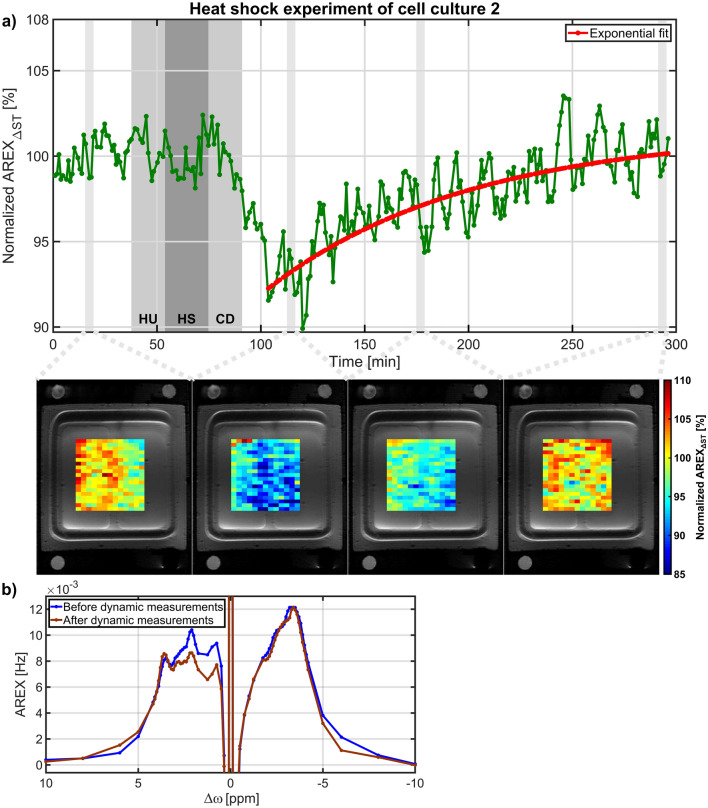
Figure 4.
(a) Time course of the rNOE signal from cell culture 2 during heat shock. The dark grey shaded background indicates the heat shock (HS) of 42 °C and the two light grey shaded backgrounds close by indicate the heat up (HU) to 42 °C and the cool down (CD) to 37 °C. Below the time course, normalized AREXΔST images of the cell area overlaid on a 1H RARE image are shown. Similarly to the dynamic measurements of cell culture 1 (Fig. 3), the rNOE signal substantially reduced by 7.7 ± 0.8% followed by an exponential recovery with a recovery time of 98.1 ± 42.4 min. A recovery of the rNOE signal to the initial value was also confirmed by the nearly identical AREX spectra before and after dynamic measurements acquired at time 0 and 295 min, respectively, which are shown in (b).

