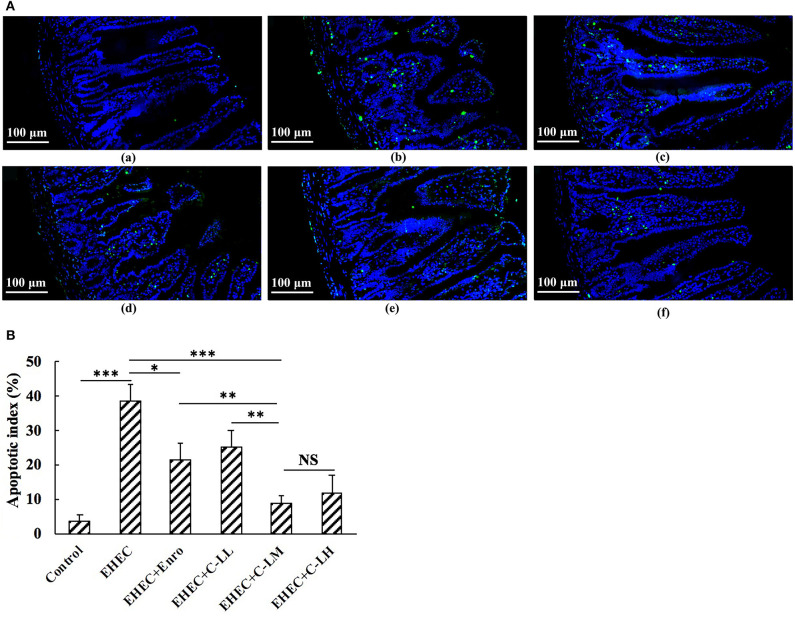
Figure 5.
TUNEL staining of jejunum tissues from the panel (A-a) control, (A-b) EHEC, (A-c) EHEC+Enro, (A-d) EHEC+C-LL, (A-e) EHEC+C-LM, and (A-f) EHEC+C-LH groups. (B) The numbers of apoptotic cells were counted based on the average number of positive (green) cells. Bar, 100 μm. The control group was orally administered 100 μL sterile PBS; the EHEC group was orally administered 100 μL sterile PBS containing 1 × 10⁸ CFUs EHEC O157:H7; the EHEC+Enro group was orally administered 100 μL sterile PBS containing 1 × 10⁸ CFUs EHEC O157:H7 and then treated by i.p. injection with 8 mg/kg Enro once/day for 3 days; the EHEC+C-LL, EHEC+C-LM, and EHEC+C-LH groups were administered 100 μL sterile PBS containing 1 × 10⁸ CFUs EHEC O157:H7 and then treated by i.p. injection with 4, 8, and 16 mg/kg C-L, respectively, once/day for 3 days. The data are shown as the mean ± standard deviation (n = 8). NS, P > 0.05; *P ≤ 0.05; **P ≤ 0.01; ***P ≤ 0.001.

