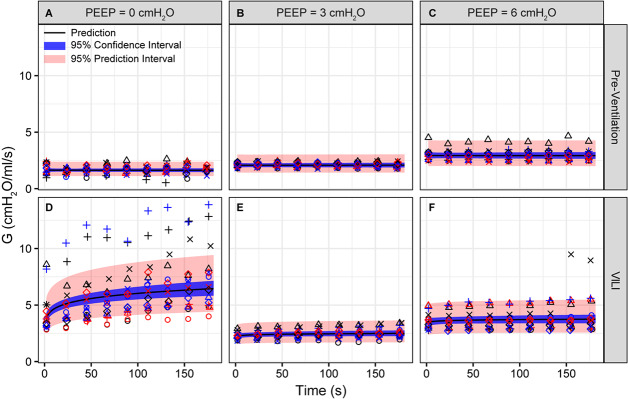
FIGURE 2.
Tissue damping (G) measured during derecruitability tests at PEEP = 0 (A,D), 3 (B,E), and 6 cmH2O (C,F) (columns) before (A–C) and after injurious mechanical ventilation (D–F). The LME model fit is shown with a black line, the 95% confidence interval is shown with a blue band, and the 95% prediction interval is shown with a red band. Symbols depict raw data for each animal and are consistent between Figures 1–3. Fifteen mice are in each group.

