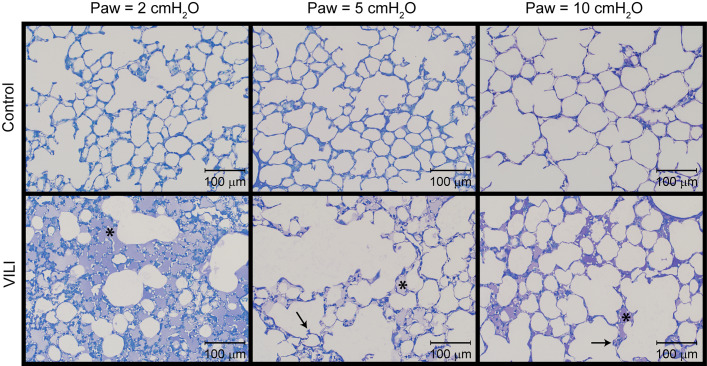
FIGURE 4.
Representative micrographs for control (first row) and VILI (second row) mice that were perfusion fixed at an airway pressure Paw = 2 cmH2O (first column), Paw = 5 cmH2O (second column), and Paw = 10 cmH2O (third column). Asterisk indicates alveolar edema and arrows denote retracted alveolar septa.

