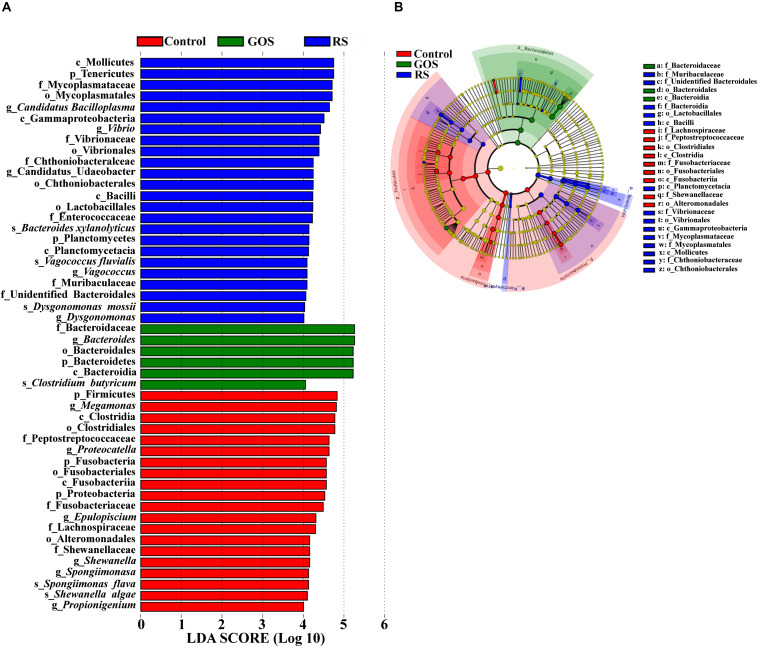
FIGURE 5.
Characterization of gut microbiota in the cultures after a 24-h in vitro fermentation of GOS and RS, as well as in the controls by LDA and LEfSe analysis. (A) Histogram of the LDA scores (log10) calculated for features differentially abundant in control, GOS, and RS samples (with LDA scores > 4.0). (B) Bacterial taxa differentially represented among groups identified by LEfSe.

