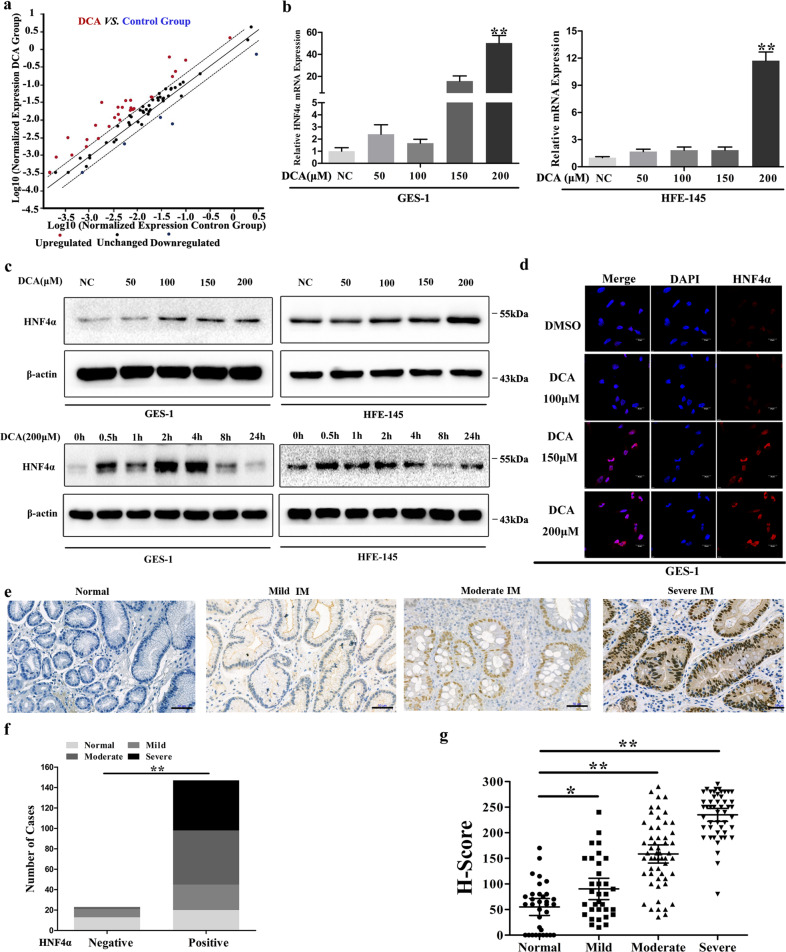
Fig. 3. Transcription factors profiling identified HNF4α as a key mediator after DCA exposure.
a GES-1 cells were treated with 200 μM DCA for 24 h and transcription factor (TF) expression profiles were examined using PCR array. Dots indicated genes over-expressed (red) and under-expressed (blue) (≥2.0 fold) in DCA group vs. Control Group. b GES-1 and HFE-145 cells were treated with different doses of DCA for 24 h. HNF4α mRNA levels were examined by qRT-PCR. Error bars indicate the SEM. **P < 0.01 vs. negative control (NC), n = 3. c GES-1 (left) and HFE-145 (right) cells were treated with DCA in dose- and time-dependent manners. HNF4α protein levels were examined by western blotting. d GES-1 cells were treated with 200 μM DCA for 24 h. HNF4α expression was analyzed by immunofluorescent staining (red). Nucleus was stained with DAPI (blue). Scale bar, 20 μm. e Immunohistochemical (IHC) staining of normal and IM tissues showed HNF4α expression. Scale bar, 50 μm. f Column charts showed the cases with positive and negative HNF4α expression in normal and IM tissues. **P < 0.01. g H-scores of HNF4α staining in normal and IM tissues (right). *P < 0.05, **P < 0.01 vs. normal.

