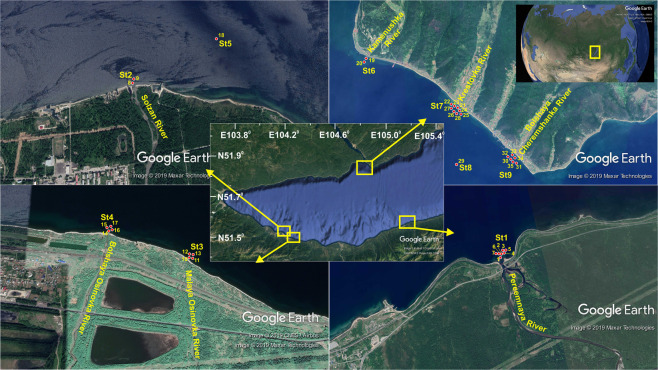
Figure 1.
Map of the sampling sites. Sample numbers correspond to the numbers in in the table with the initial data (https://github.com/barnsys/bac_phyt_communities). Geographic coordinates of stations (degrees and decimal places): St1 51.56891 N, 105.16609; St2 51.49722 N, 104.15836 E; St3 51.50056 N, 104.25354 E; St4 51.50056 N, 104.24403 E; St5 51.53875 N, 104.19746 E; St6 51.84457 N, 104.87505 E; St7 51.85535 N, 104.85970 E; St8 51.86710 N, 104.83247 E; St9 51.84429 N, 104.83949 E. Maps were taken from the Google Earth Pro software (https://www.google.com/intl/ru/earth/versions/#earth-pro). «Inkscape» (https://inkscape.org/) free graphics editor was used to edit images and apply additional marks to maps.

