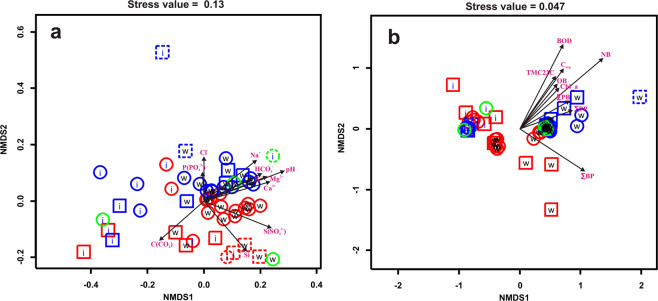
Figure 2.
Scatter plots of sampling sites in two-dimensional NMDS space. (a) parameters describing biological processes are treated as explained variables, hydrochemical parameters are treated as explanatory ones, (b) hydrochemical parameters are explained, biological parameters are explanatory. Red — eastern coast, blue — western coast; green circles represent pelagic samples; circles — samples taken from the lake near river mouths, squares — river mouths; dashed blue squares are samples taken near the mouth of Bolshaya Cheremshanka river; dashed red pointers are samples taken near Bolshaya Osinovka and Malaya Osinovka rivers; w — water samples, i — ice samples. Plots show only the vectors of gradient for explanatory variables significantly affecting the datasets of explained variables (Tables 1 and 2).

