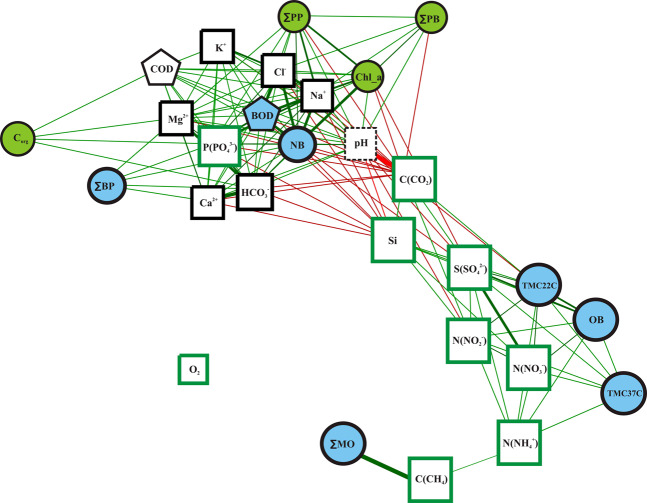
Figure 4.
The network of correlations between all measured parameters (both biological and hydrochemical). Blue shapes mark the parameters related to the bacterial activity, green circles mark the parameters related to phytoplankton activity, black squares — mineral ion concentrations, green squares — concentrations of biogenic elements, pentagons mark the rate of biogenic and chemical oxidation of organic matter. Green edges mean significant positive correlations, red edges mean significant negative correlations.

