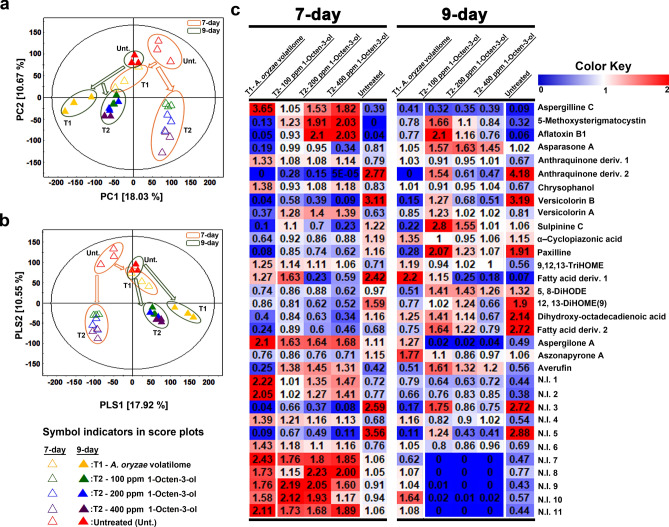
Figure 3.
The multivariate score plots (a) PCA, (b) PLS-DA and (c) the heat-map for the relative abundance of significantly discriminant metabolites (VIP > 0.7 and p < 0.05), based on the UHPLC-LTQ-Orbitrap-MS datasets. The data highlights a marked disparity in the secondary metabolite profiles of A. flavus subjected to varying VOC treatments (T1 and T2) compared to the untreated sets, on 7 and 9 days of incubation during twin-plate experiment.

