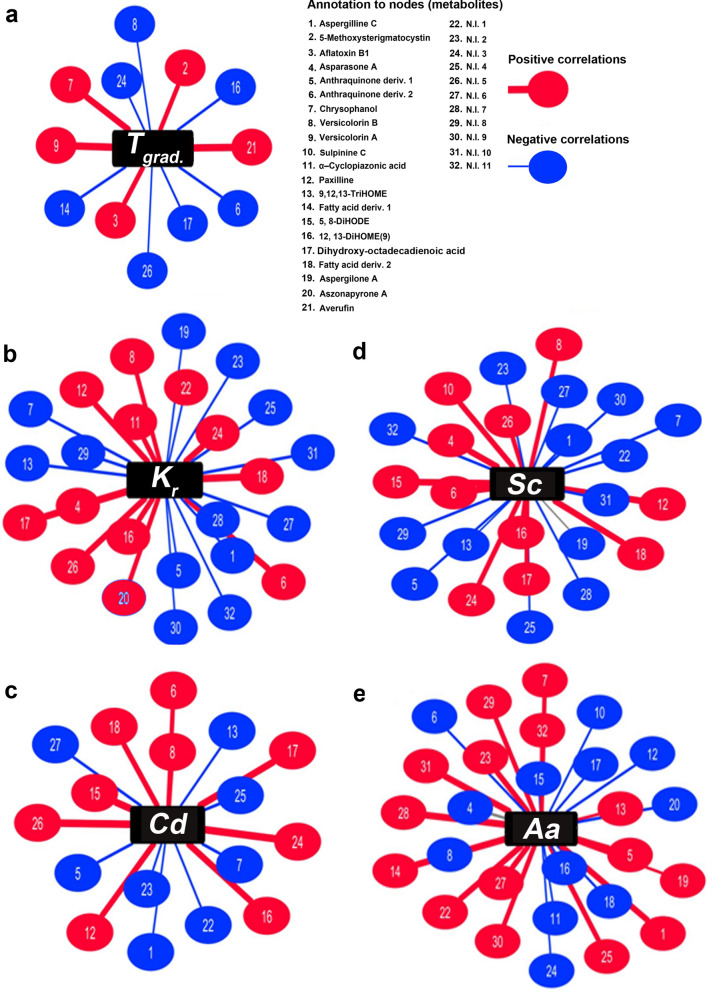
Figure 4.
The spring-embedded network indicating the individual correlations between the significantly discriminant secondary metabolite levels and (a) the 1-Octen-3-ol gradient treatments, Tgrad. (b) mycelial growth rates, Kr (c) conidial density, Cd (d) sclerotial counts, Sc and (e) secreted α-amylase activity, Aa for A. flavus subjected to varying VOC treatments. The nodes of the network represent the metabolites indicated with unique codes while the edges display the significant correlations (Pearson's coefficient r, 0.4 > and < − 0.4 at p < 0.01) for multiple testing. The positive and negative correlations are indicated with red and blue colored nodes, respectively.

