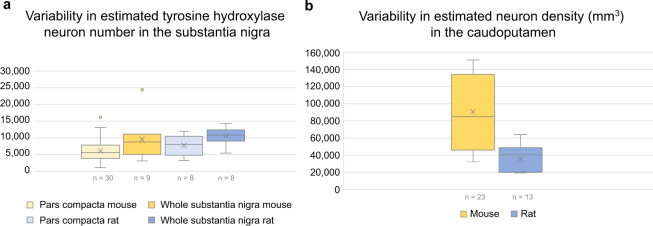
Fig. 5.
Variability of estimates from the literature. Figure showing summary data for estimates from the database. The whiskers represents the values that fall within 1.5 times the interquartile range. (a) Box plot showing total number estimates of TH positive cells in one hemisphere of the substantia nigra pars compacta (light yellow and light blue boxes for mouse and rat, respectively) and the whole substantia nigra (including the compact, reticular and lateral parts, which in some studies also may have included parts of the ventral tegmental area; dark yellow and dark blue boxes for mouse and rat, respectively). (b) Box plot showing neuron density estimates in the caudoputamen of mice (yellow box) and rat (blue box). The n represents the number of estimates, but note that more than one of these could originate from the same publication or repository source.

