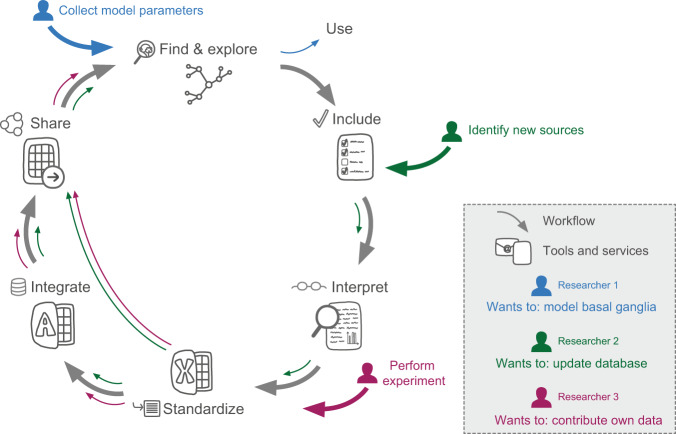
Fig. 6.
Workflow for integration of derived data. Schematic representation of the main workflow described in this paper, as well as the tools and services used (in grey). Coloured arrows indicate specific ways different users may interact with the database or the workflow, today or in the future. Blue arrows illustrate how a researcher may use the database to identify data to constrain a computational model of the basal ganglia. Through the EBRAINS Knowledge Graph, derived data may be found as a shared dataset25, downloaded and explored. Green and purple arrows show how researchers may use the workflow and resources developed to update the database in the future, identifying and interpreting new sources (green arrows) or by contributing own data (purple arrows). In the workflow, data are included by use of specific criteria, and interpreted manually. Derived data are extracted and standardised to common units of measurement using a custom Excel workbook. The Excel workbook is designed for input of data as well as minimum metadata according to the EBRAINS standard. Optionally, more extensive metadata may be integrated through a Microsoft Access database input portal. Once organised, derived data may be shared through the EBRAINS curation support, through which it can be made available as part of the collection found in the Knowledge Graph.

