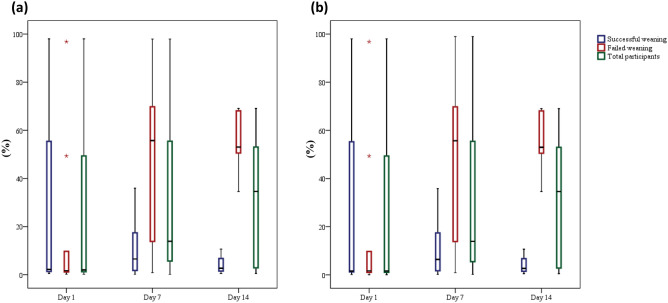
Figure 4.
Changes over time in the relative abundance of (a) Acinetobacter genus, the p values for trend were 0.151, 0.012 and 0.335 for all participants, patients with failed weaning, and patients with successful weaning, respectively; and (b) Acinetobacter Baumannii complex species, the p-values for trend were 0.113, 0.012 and 0.426 for all participants, patients with failed weaning, and patients with successful weaning, respectively.

