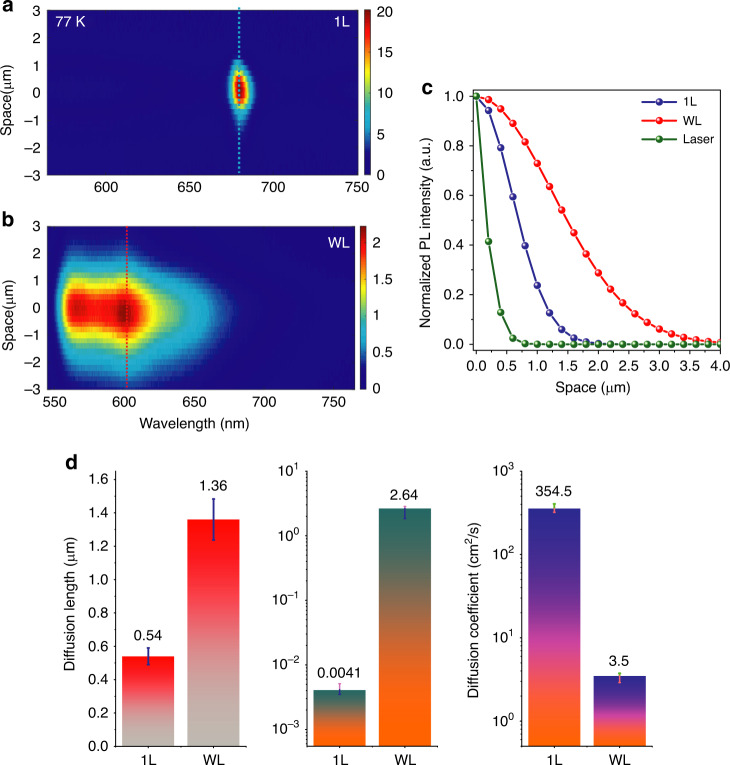
Fig. 3. Exciton transport mapping using near-field imaging.
a, b Measured contour plots of PL intensity as a function of emission wavelength and space of exciton diffusion for 1L (a) and WL (b) pentacene samples at 77 K. The middle of the laser excitation spot is at x = 0. c Spatial profiles plotted along the dotted lines in a, b for different types of excitonic peaks, showing the diffusion lengths of excitons in WL and 1L. d Comparison plots of diffusion lengths (left; from Fig. 3a–c), lifetime (middle; from Fig. 2e) and extracted diffusion coefficients measured from WL and 1L samples at 77K. The error bars represent the experimental variation observed in measurements of multiple samples

