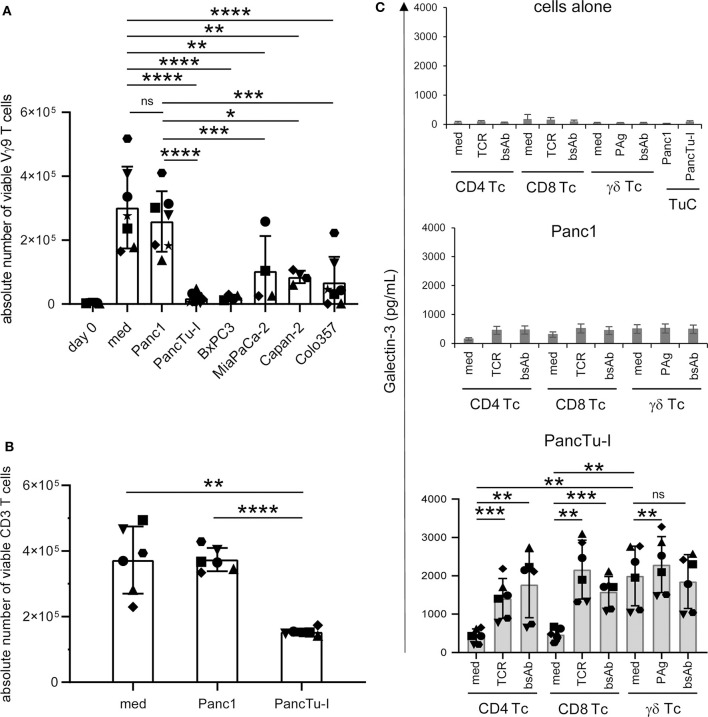
Figure 2.
Coculture of PDAC cells with PBMC induces galectin-3 release and inhibition of γδ T cell proliferation. (A–C) In total, 5 × 10³ of the indicated PDAC cells were plated in complete medium. After 24 h (A,B) 2.5 × 10⁵ PBMC (n = 4–7) or (C) 2 × 10⁵ freshly isolated CD4 or CD8 αβ T cells or γδ T cells (Tc) (n = 6) were added or cultured alone (medium). Cells were stimulated (A) with 2.5 μM zoledronic acid in the presence of 50 IU/mL rIL-2, (B) with Activation/Expander Beads or (C) with Activation/Expander Beads (TCR), 300 nM BrHPP (PAg) plus rIL-2 or 1 μg/mL bsAb [HER2xCD3] for αβ T cells and [(HER2)2xVγ9] plus rIL-2 for γδ T cells. (A,B) Vγ9 γδ T cell proliferation was determined after 6–7 days and αβ T cell proliferation after 3–4 days by SCDA. The means ± SD of duplicates are shown. (C) Cell culture supernatants were collected after 72 h and released gal-3 was determined by ELISA. The bars represent the mean ± SD (n = 6), determined in duplicates. Statistical comparison of (A) non-matched samples was carried out parametrically by using one-way ANOVA followed by Tukey's multiple comparison test, and of (B,C) matched samples also parametrically by using paired, two-tailed t-test. P-value; *P < 0.05, **P < 0.01, ***P < 0.001, ****P < 0.0001, and ns, non-significant.

