Figure 5.
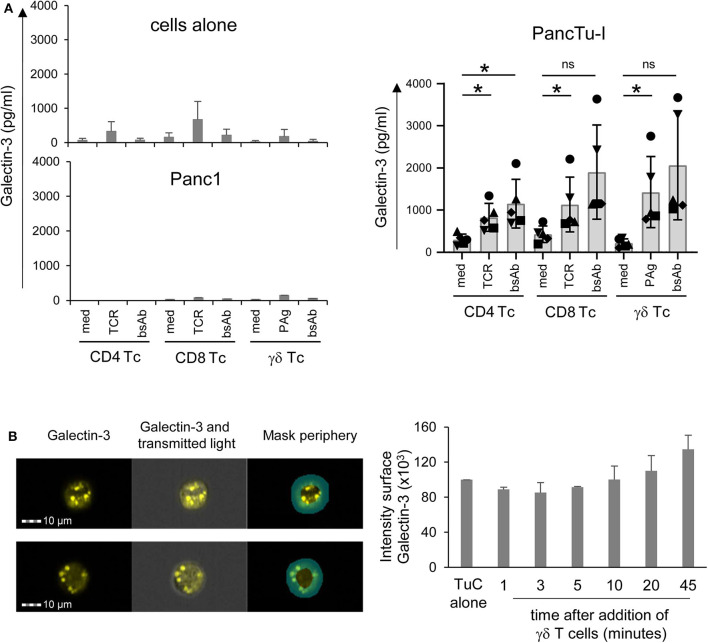
Coculture of PancTu-I cells with activated γδ T cells increases galectin-3 release and its localization in the tumor cell periphery. (A) In total, 5 × 10³ indicated PDAC cells were plated in complete medium. After 24 h, 2 × 10⁵ short-term activated CD4 or CD8 αβ T cells or γδ T cells (Tc) (n = 6) were added or cultured alone (cells alone). Cells were stimulated with Activation/Expander Beads (TCR), 300 nM BrHPP (PAg) plus 12.5 IU/mL rIL-2 or 1 μg/mL bsAb [HER2xCD3] for αβ T cells and [(HER2)2xVγ9] plus 12.5 IU/mL rIL-2 for γδ T cells. Cell culture supernatants were collected after 72 h and gal-3 was determined by ELISA. The means ± SD of duplicates are shown. Statistical comparison was carried out parametrically by using paired, two-tailed t-test. P-value; *P < 0.05. As samples of CD8 and γδ T cells cultured in medium in comparison to bsAb did not follow a normal distribution, a Wilcoxon non-parametric, matched-pairs signed rank test was applied, which revealed no significance (ns, non-significant). (B) PancTu-I cells alone or cocultured with short-term activated Vγ9 γδ T cells for the indicated time. Thereafter, cells were stained with anti-gal-3 mAb (clone Gal397) followed by secondary goat-anti-mouse Ab and anti-EpCAM mAb (clone REA-125) for tumor cells, anti-CD3 (clone UCHT-1) for T cells and phalloidin for actin-filament staining and analyzed on the ImageStream® X Mark II. The fluorescence image of gal-3 plus overlays with transmitted light image and peripheral mask of a representative PancTu-I cell with gal-3 expression predominately in the center or periphery is shown. In addition, the mean ± SD of the intensity of gal-3 expression in the periphery of PancTu-I cells after addition of γδ T cells (n =3) are presented.

