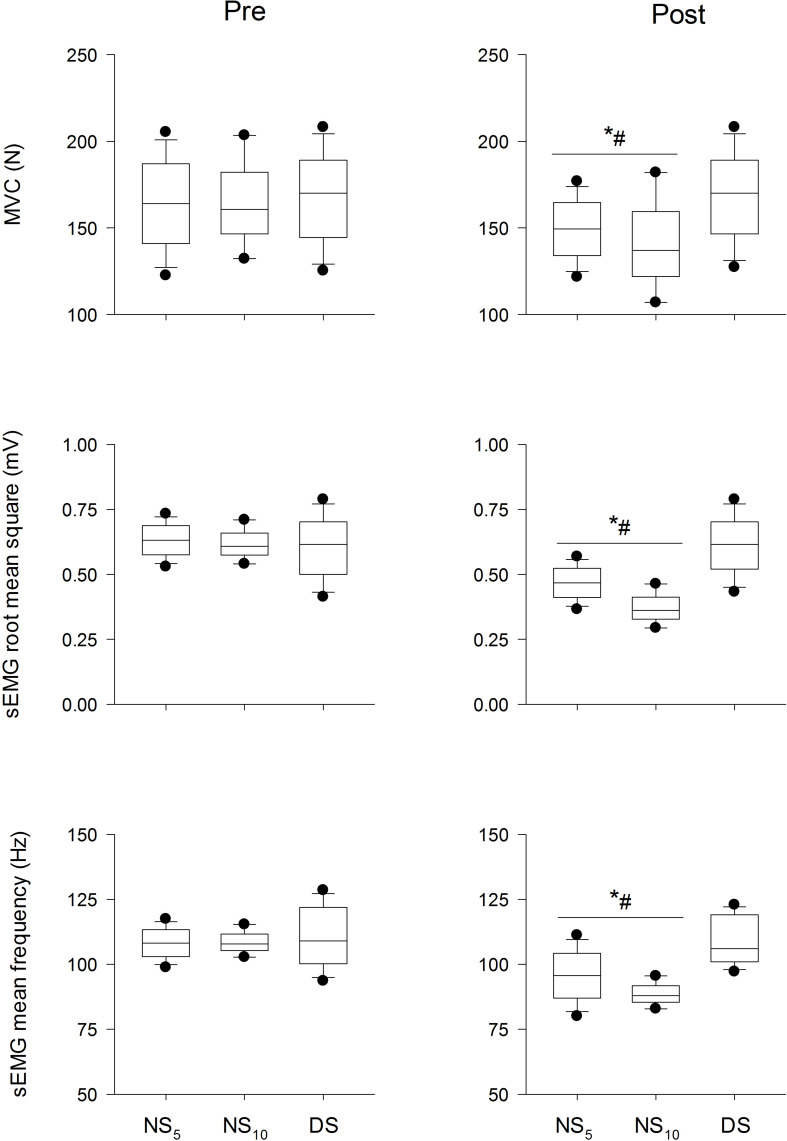
FIGURE 3.
Maximum voluntary contraction force (MVC, upper panel), surface electromyogram root mean square (sEMG RMS, middle panel), and mean frequency (sEMG MF, lower panel) at the beginning (pre) and at the end (post) of the shift cycle for the three groups. NS5, 5-day night shift; NS10, 10-day night shift; DS, day/swing shift. *p < 0.05 post vs. pre; #p < 0.05 NS5 or NS10 vs. DS. Black dots represent the 95th/5th percentile.

