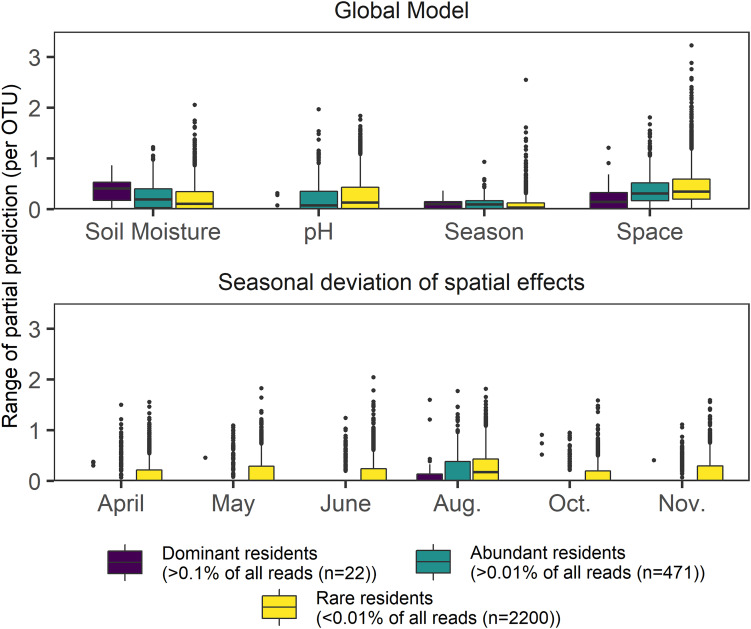
FIGURE 4.
Boxplots showing the response range of partial effects assigned by GAMs to the four most frequently picked variables in a global model encompassing space, season, and environmental variables. The dataset was separated by relative abundance and includes 2693 OTUs, which were modeled using negative binomial GAMs; lower panel depicts temporal deviations from the main spatial effect found in a global model. Effect size values were not scaled.

