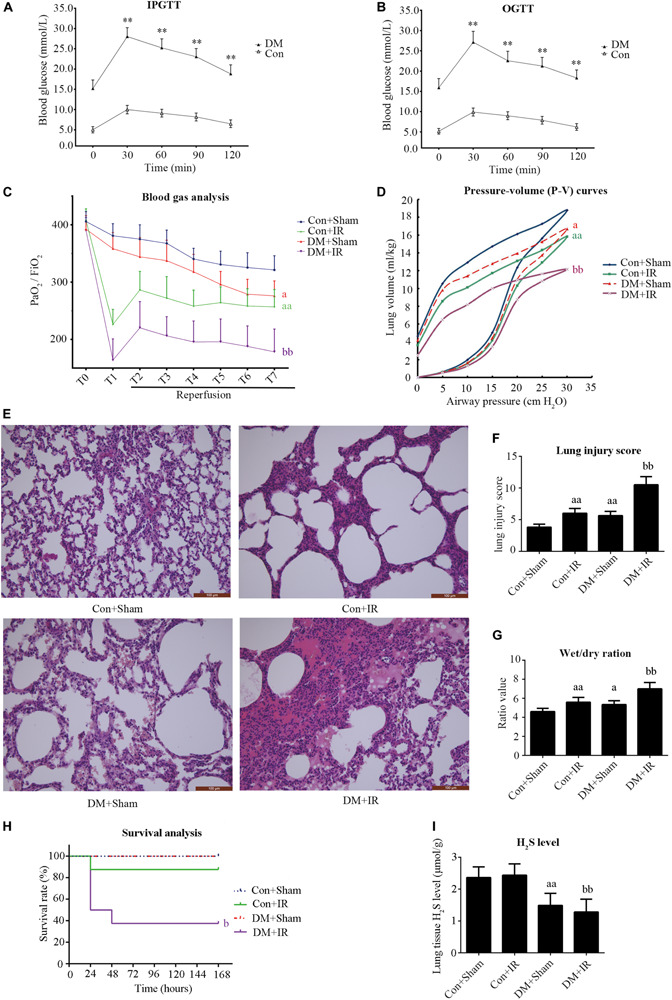
FIGURE 1.

Type 2 diabetic rats subjected to lung IR injury exhibited significantly impaired lung function. (A) IPGTT, intraperitoneal glucose tolerance test. (B) OGTT, oral glucose tolerance test. (C) Arterial blood gas analysis. T0–T7 represent the following time points: baseline, end of ischemia, and 30, 60, 90, 120, 180, and 240 min after reperfusion. (D) Static compliance of the lung pressure–volume (P–V) curves. Data are represented by the mean values, and the bars are omitted for clarity. (E) Histologic analysis of lung tissues (magnification: 200×). (F) Lung injury score. (G) Wet/dry weight ratio. (H) Survival analysis. Rats were observed for 168 h (1 week), and survival time was calculated. (I) Lung H2S levels in rat. PaO2/FiO2: partial pressure of arterial oxygen (PaO2)/fraction of inspired oxygen (FiO2). IR, ischemia-reperfusion; DM, diabetes mellitus (**P < 0.01 versus Con group, aP < 0.05 versus Con + sham group/aaP < 0.01 versus Con + sham group, bP < 0.05 versus Con + IR group/bbP < 0.01 versus Con + IR group; n = 8 in each group).
