
FIGURE 2.
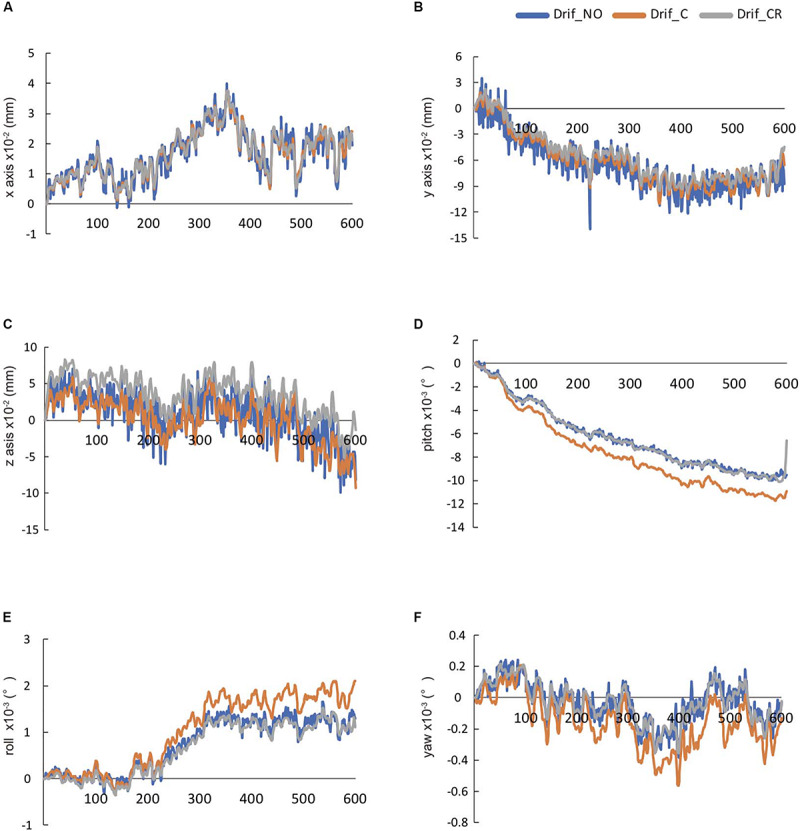
The temporal changes in 600-s head movement in raw data. These data were automatically calculated by DPARSF. The head movement in x-axis (A), y-axis (B), and z-axis (C), respectively. The head rotation movement of pitch in x-axis (D), roll in y-axis (E), and yaw in z-axis (F), respectively.