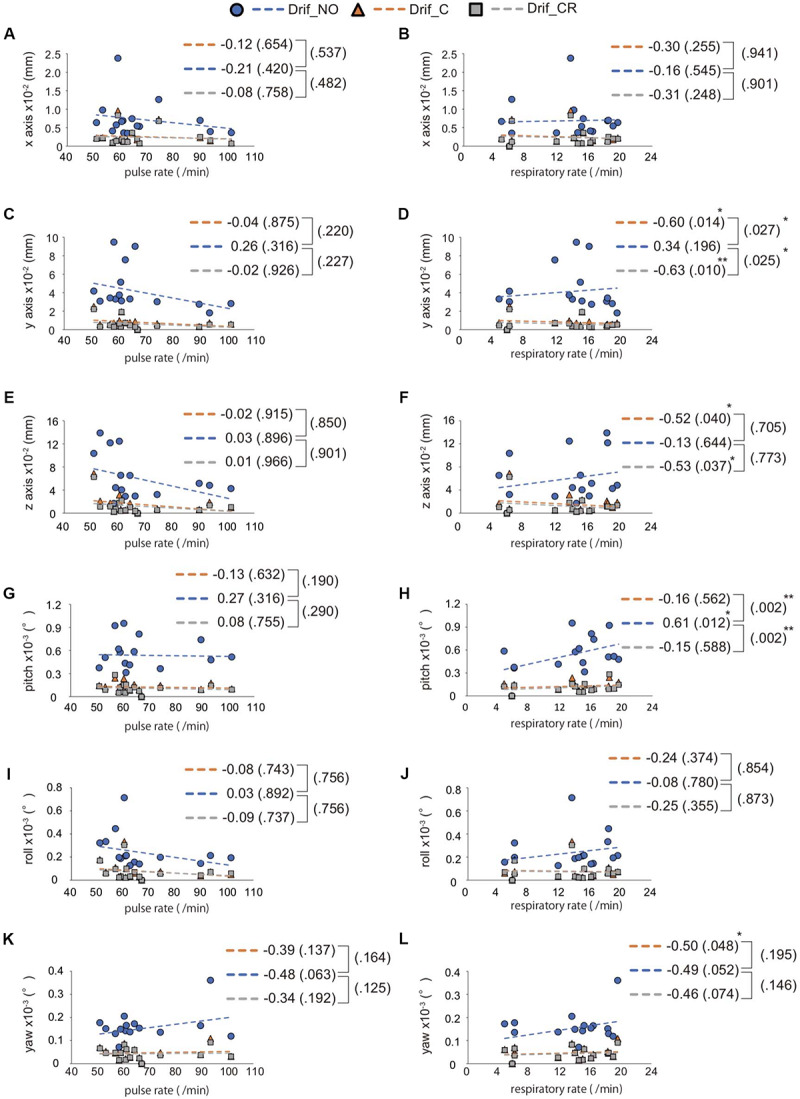
FIGURE 3.

Interaction between RR/PR and the average of head movement. The left side image (A,C,E,G,I,K) indicates the relationship between pulse rate (PR) and head movement, whereas the right side image (B,D,F,H,J,L) indicates the relationship between respiratory rate (RR) and head movement. The direction of head movement is indicated on the x-axis (A,B), y-axis (C,D), and z-axis (E,F). The rotation of head movement indicates pitch (G,H), roll (I,J), and yaw (K,L). The correlation coefficient is shown in the side of each broken line and p-value for correlation coefficient is shown in parentheses. The result of interaction between Drif_NO and Drif_C or Drif_CR is indicated on the right side of the single bracket as a p-value in parentheses. There is no significant correlation coefficient and interaction between head movement and PR but significant difference is shown in correlation coefficient and interaction between head movement and RR. ∗p < 0.05, ∗∗p < 0.01, with statistical analysis. See Table 2 for the distance of head movement and the angle of head rotation.
