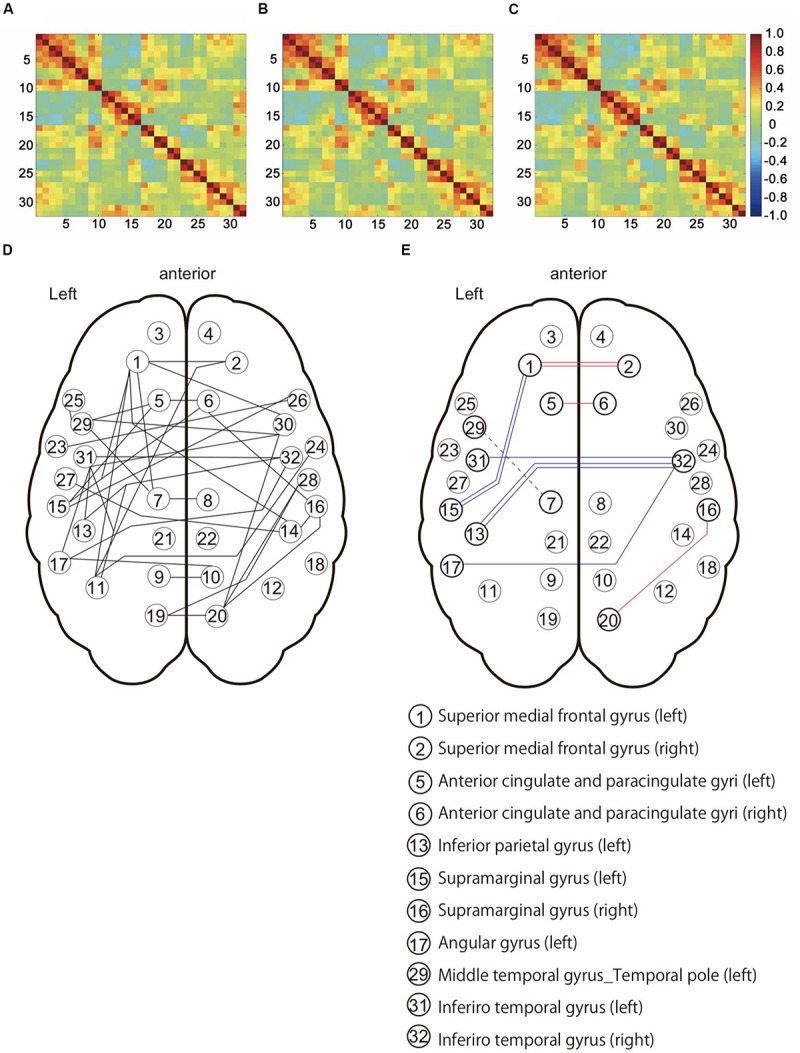
FIGURE 4.

Functional connectivity patterns among the default mode network (DMN) and DMN-related brain regions in 16 subjects. (A) Connectivity matrix with no corrected physiological noise (Drif_NO). (B) Connectivity matrix corrected for cardiac noise (Drif_C). (C) Connectivity matrix corrected for cardiac and respiratory noise signals (Drif_CR). The value of these three matrixes is the correlation coefficient (r). (D) This network showed significant difference in the three conditions (Drif_NO, Drif_C, and Drif_CR) using Network-Based Statistic (NBS) (Zalesky et al., 2010a). (E) Results of FC strength with significant difference. Following NBS analysis, paired t-test and post hoc false discovery rate (FDR) correction was performed so as to further evaluate the strength of individual FC. The number of 13 nodes and 8 FC had significant differences. The red line indicates an increase in FC strength, while the blue line indicates a decrease in FC strength compared to no physiological noise correction. The single red line indicates that FC of Drif_C was significantly increased compared to Drif_NO. The double red line indicates that FC of both Drif_C and Drif_CR was significantly increased compared to Drif_NO. The single blue line indicates that FC of Drif_C was significantly decreased compared to Drif_NO. The double blue line indicates that FC of both Drif_C and Drif_CR was significantly decreased compared to Drif_NO. The broken blue line indicates that FC of Drif_CR was significantly decreased compared to Drif_NO. See Table 3 for the z-value in each strength of FC.
