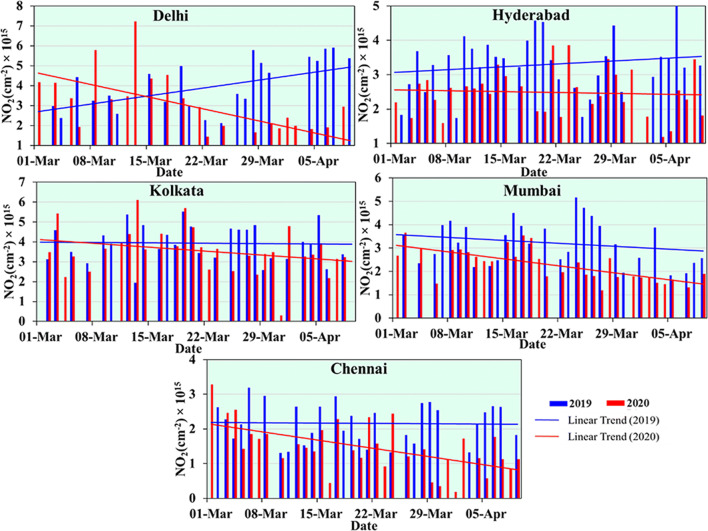
Fig. 5.
Temporal variations of tropospheric NO2 over US Consulate locations (Delhi, Mumbai, Chennai, Hyderabad, and Kolkata) in India during 1 March to 9 April 2020. The blue and red lines show a linear trend in average concentration of tropospheric NO2 during 2019 and 2020. Decreasing trend is seen in all cities, and in Delhi and Kolkata, contrast in trend is seen during 2019 and 2020

