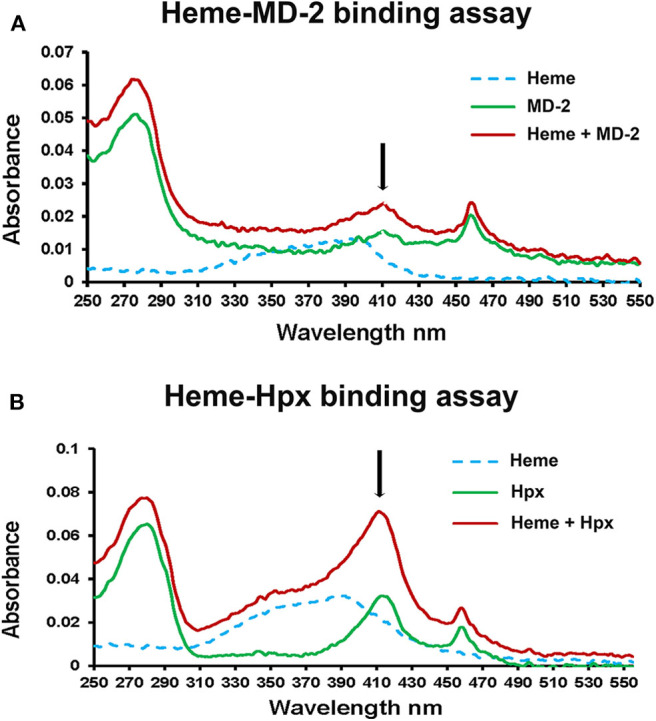
Figure 2.

Heme binds to MD-2 in absorbance spectroscopy assay. (A) The UV/Vis absorption spectra (250–550 nm) of heme (10 μM, dashed blue line), recombinant MD-2 (green line), and heme + MD-2 (red line) were measured. (B) As a positive heme-binding control, the experiment was repeated using recombinant human Hpx instead of MD-2. The black arrows show the location of a characteristic Soret peak at ~414 nm seen in heme proteins. The results shown in (A,B) are representative of three independent experiments. Each spectrum was blanked against the buffer vehicle.
