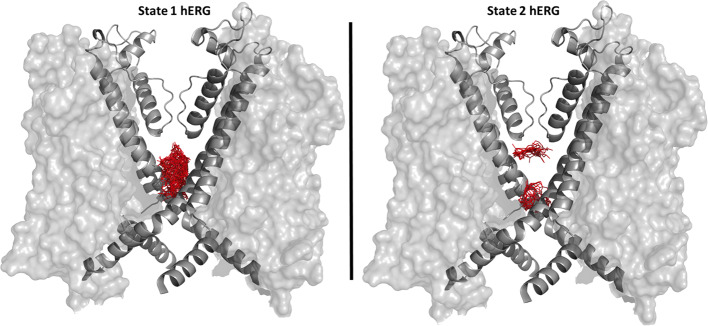
Figure 8.
Distributions of docked poses for dofetilide is shown as sticks in red for the state 1 hERG1 (cryo-EM equilibrated) on the left side and state 2 MD derived hERG1 on the right side. For clarity purposes only the pore domain S6 helices of two subunits are shown as cartoons, the voltage sensing domain is represented as a transparent surface.

