Figure 2.
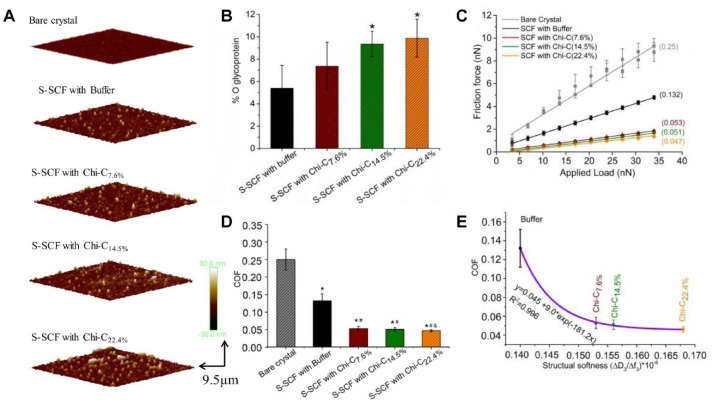
Secondary salivary conditioning film (S-SCF) change in composition, measured using X-ray photoelectron spectroscopy (XPS), in topography and nanofriction, measured by atomic force microscopy (AFM) and colloidal probe. (A) Surface topography of bare Au-coated crystal and S-SCF treated with buffer, Chi-C7.6%, Chi-C14.5%, and Chi-C22.4%, respectively. (B) The amount of glycoprotein (%O) in S-SCF with buffer or different conjugate degree Chi-C treatment was obtained from decomposition of O1s photoelectron peak in XPS. (C) Friction force versus applied load curves of bare quartz crystal microbalance with dissipation (QCM-D) crystal and S-SCF treated with buffer or Chi-C, respectively. (D) Coefficient of friction (COF) of each S-SCF calculated by slope of the linear fitting. (E) Correlation between structural softness of S-SCF and COF, and the higher structural softness of S-SCF the lower COF of S-SCF in vitro with colloidal probe AFM was achieved. *Statistically significant differences (P < 0.05) in the content of glycoprotein in S-SCF with Chi-C treatment with respect to S-SCF with buffer treatment in (B), or in COF between S-SCF and bare crystal in (D). #Statistically significant (P < 0.05) difference in COF of S-SCF treated with Chi-C respect to S-SCF treated with buffer. &Significant difference in COF between S-SCF with Chi-C22.4.% and Chi-C7.6% treatment, respectively. Chi-C, chitosan-catechol.

