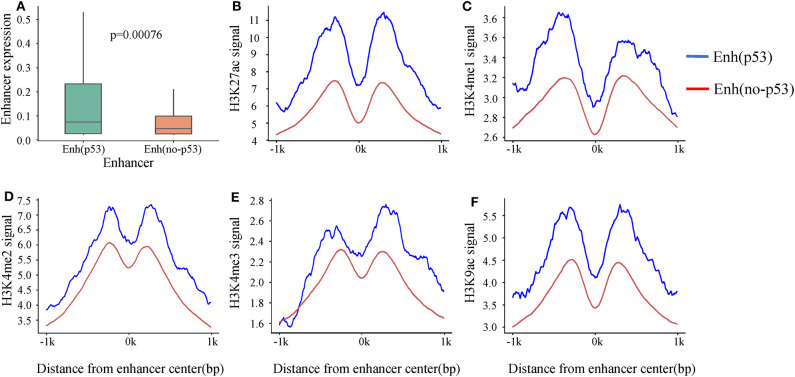
Figure 2.
The differences in expression and histone modification of the two types of enhancers. (A) The expression of the two types of enhancers. p-value is calculated by Wilcoxon test. (B–F) Different histone modification on the two types of enhancers. The blue line represents Enhp53, and the red line marks Enhno−p53.

