-
A
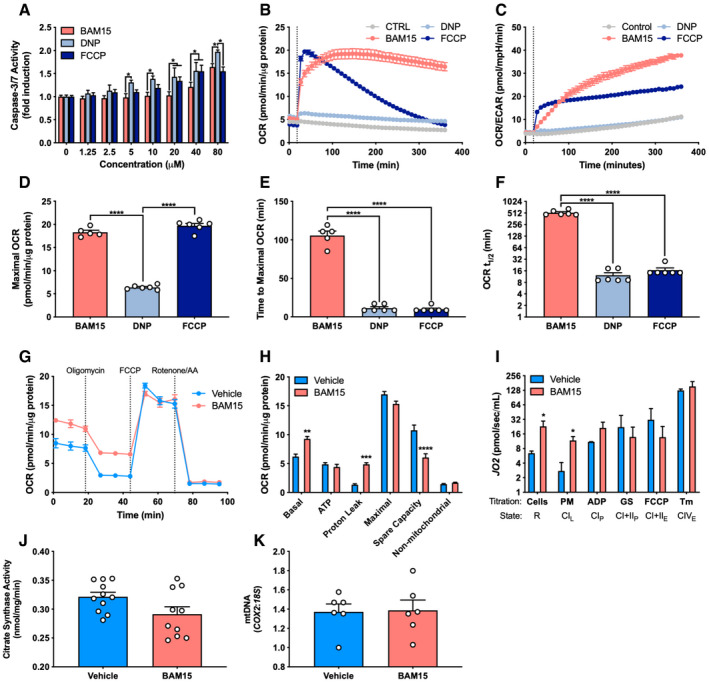
Caspase 3/7 activation ± 16‐h treatment with varying concentrations of BAM15, DNP, or FCCP (N = 3 per condition). 5 μM: BAM15 versus DNP (P = 0.030). 10 μM: BAM15 versus DNP (P = 0.013). 20 μM: BAM15 versus DNP (P = 0.0005), BAM15 versus FCCP (P = 0.036). 40 μM: BAM15 versus DNP (P = 0.018), BAM15 versus FCCP (P = 0.021). 80 μM: BAM15 versus DNP (P = 0.018), DNP versus FCCP (P = 0.004).
-
B–F
(B) The rate of oxygen consumption (OCR), (C) ratio of oxygen consumption to extracellular acidification (OCR/ECAR), (D) maximal rate of OCR (BAM15 versus DNP, P < 0.0001; DNP versus FCCP (P < 0.0001), (E) time to maximal uncoupling rate (BAM15 versus DNP, P < 0.0001; BAM15 versus FCCP (P < 0.0001), and (F) mitochondrial respiratory half‐life following acute injection of 1 μM BAM15, DNP, or FCCP (BAM15 versus DNP, P < 0.0001; BAM15 versus FCCP) (P < 0.0001) (N = 6 per condition).
-
G, H
(G) Representative respirometry plot of intact cells ± 16‐h treatment with 20 μM BAM15 sequentially injected with oligomycin, FCCP, and a cocktail of rotenone and antimycin a (N = 5 per condition) and (H) basal (P = 0.002) and ATP‐linked respiration, proton leak (P = 0.0003), maximal uncoupling, spare respiratory capacity (P < 0.0001), and non‐mitochondrial respiration (N = 5 per condition).
-
I
Assessment of routine (R) oxygen flux (P = 0.030), leak (L) (P = 0.010), OXPHOS (P), and ETC. (E) capacity in permeabilized C2C12 cells ± 16‐h treatment with BAM15 (N = 4 per condition). PM: pyruvate and malate, ADP: adenosine diphosphate, GS: glutamate and succinate, Tm: tetramethyl‐p‐phenylenediamine.
-
J
Citrate synthase activity ± 16‐h treatment with 20 μM BAM15 (N = 10 per condition).
-
K
mtDNA (COX2:18S) ± 16‐h treatment with 20 μM BAM15 (N = 6 per condition).
Data information. Data are shown as the mean ± SEM. *
< 0.001. Panels A, H, and I were assessed by two‐way repeated‐measures ANOVA with Tukey's multiple comparisons. Panels D, E, and F were assessed by one‐way ANOVA with Tukey's multiple comparisons. Panels J and K were assessed by unpaired Student's
‐test.