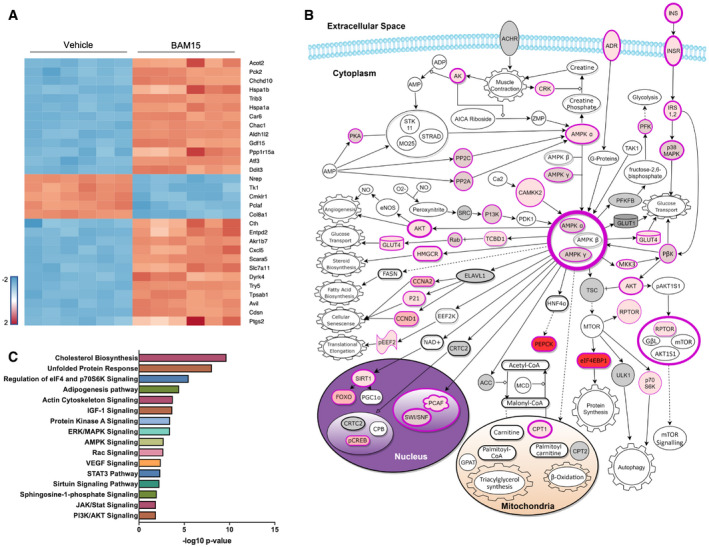
Figure 2. BAM15 alters the expression of metabolic genes related to energy homeostasis.

-
AHeat map visualization of top 30 differentially regulated mRNA transcripts. Color represents significant downregulated (blue) or upregulated (red) mRNA expressed as a log2 fold change relative to vehicle corrected for the false discovery rate.
-
BSchematic illustration of differentially regulated mRNA transcripts involved in the AMPK signaling pathway. Structures highlighted in shades of red were differentially regulated by BAM15. Darker shades of red correlate with increased probability of activation. Structures highlighted in gray or with black borders were unaltered by BAM15.
-
CPathway enrichment analysis of differentially regulated mRNA transcripts.
