-
A
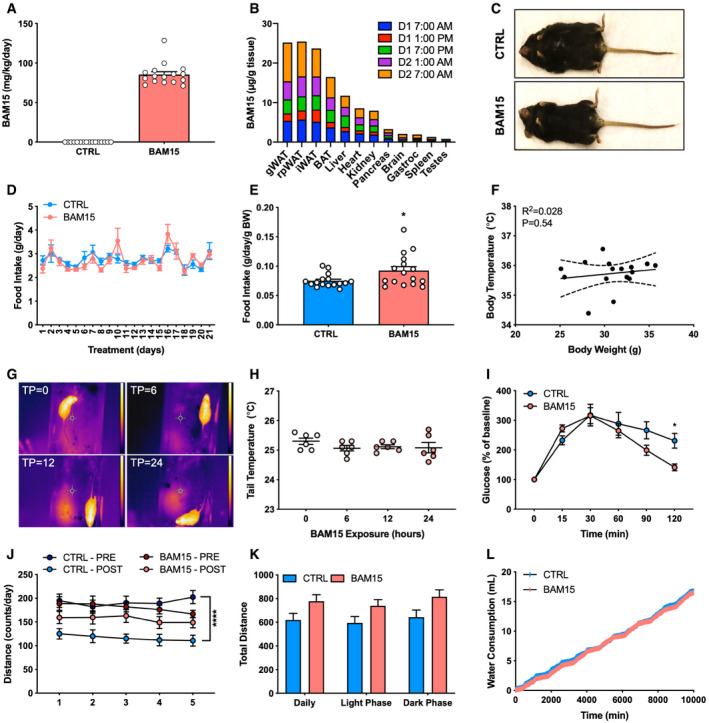
Representative image of a CTRL‐ and BAM15‐treated animal at time of necropsy.
-
B, C
(B) Daily consumption (N = 16 per group) and (C) tissue distribution of BAM15 over a 24‐h feeding period (N = 3 per time point).
-
D, E
(D) Daily food intake over the 3‐week treatment period (N = 16 per group) and (E) mean food intake expressed relative to body weight (N = 16 per group; P = 0.0275).
-
F
Relationship between body temperature and weight after 3 weeks of treatment (N = 16).
-
G, H
(G) Representative thermal image of a mouse exposed to 0, 6, 12, and 24 h of BAM15 (TP = 0, 6, 12, and 24, respectively). Scale bar (right of image) represents 22–32° (dark blue to white) temperature range. (H) Tail heat dissipation of mice exposed to 0, 6, 12, and 24 h of BAM15 (N = 6 per time point).
-
I
Glucose concentrations in response to IPGTT expressed as a percent of baseline (N = 8 per group; 120 min: P = 0.0413).
-
J–L
(J) Daily physical activity before (PRE) and 3 weeks (POST) of CTRL or BAM15 treatment (N = 8 per group; CTRL PRE–POST: P < 0.0001) and (K) cumulative physical activity following 3 weeks of CTRL or BAM15 treatment (N = 8 per group). (L) Cumulative water consumption over a 7‐day period ((N = 8 per group).
Data information: Data are shown as the mean ± SEM. *
P < 0.05, ****
P < 0.001. Comparisons of treatment × time were assessed by two‐way repeated‐measures ANOVA with Tukey's multiple comparisons. Panels J‐L were assessed by a repeated‐measures ANOVA with body weight as a covariate. Comparisons of treatment alone were assessed by an unpaired Student's
t‐test. Bivariate relationships were determined by linear regression modeling followed by statistical evaluation with Pearson's r. Dotted lines represent 95% confidence intervals.

