-
A, B
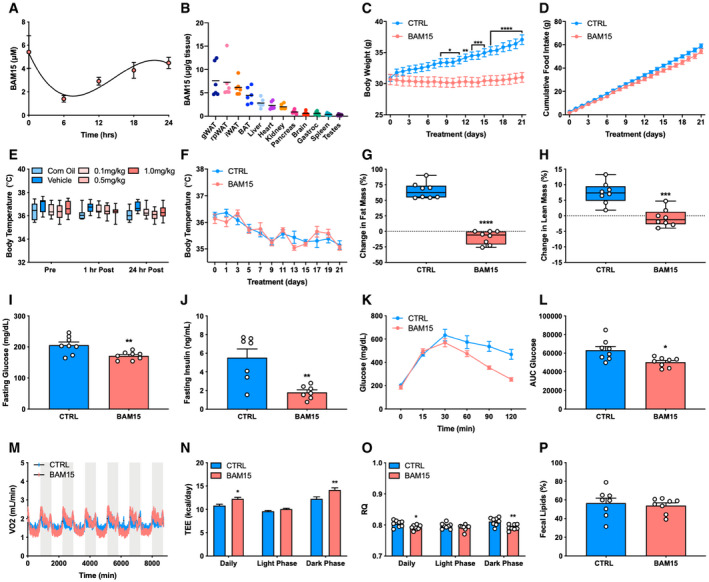
(A) Serum concentrations of BAM15 over a 24‐h period (N = 3 animals per time point) and (B) peak tissue concentrations of BAM15 (N = 6 per tissue).
-
C, D
(C) Daily body weight (day 8: P = 0.0454, day 9: P = 0.0353, day 10: P = 0.0251, day 11: P = 0.0131, day 12: 0.0038, day 13: P = 0.0008, day 14: P = 0.0005, day 15: P = 0.0003, day 16–21: P < 0.0001) and (D) cumulative food intake over the 3‐week treatment in CTRL‐ and BAM15‐treated animals (N = 16 per group).
-
E, F
(E) Whole‐body temperature before (pre), 1 h (1 h post), and 24 h (24 h post) after intraperitoneal injection of corn oil, vehicle (corn oil and saline), 0.1, 0.5, and, 1 mg BAM15 per kg of body weight (N = 11 per group), and (F) daily during chronic BAM15 treatment (N = 8 per group).
-
G, H
(G) Change in fat mass (%) (P < 0.0001) and (H) lean mass (%) (P < 0.0001) from baseline to 3 weeks in CTRL‐ and BAM15‐treated animals (N = 8 per group).
-
I–L
(I) Fasting plasma glucose (N = 8 per group; P = 0.007) and (J) insulin (N = 7 per group; P = 0.0024) after 3 weeks of treatment in CTRL‐ and BAM15‐treated animals. (K) Plasma glucose concentrations at 0, 15, 30, 60, 90, and 120 min following intraperitoneal injection of glucose (2 g glucose/kg of body weight; N = 8 per group) and (L) total area under the curve glucose after 3 weeks in CTRL‐ and BAM15‐treated animals (N = 8 per group; P = 0.0106).
-
M–O
(M) Oxygen consumption rates (N) energy expenditure (daily: P = 0.0357, dark phase: P = 0.030), and (O) respiratory exchange ratio (daily: P = 0.0424, dark phase: P = 0.0016) measured by continuous high‐resolution indirect calorimetry after 3 weeks of CTRL or BAM15 treatment (N = 8 per group).
-
P
Fecal energy density (% recovered in feces) after 3 weeks of CTRL or BAM15 treatment (N = 8 per group).
Data information: Data are shown as the mean ± SEM with exception to panel B with exception to panels E, H, and G which are displayed as a box (mean ± 5–95% CI) and whiskers (minimum to maximum) plot. *
P < 0.05, **
P < 0.01, ***
P < 0.01, ****
P < 0.001. Panels C, D, E, F, N, and O were assessed by two‐way repeated‐measures ANOVA with Tukey's multiple comparisons. Panels G, H, I, J, L, and P were assessed by an unpaired Student's
t‐test.